
Sarah Banschbach Valles
Rebecca Day Babcock
Karen Keaton Jackson
The Peer Review, Volume 1, Issue 1, Spring 2017
It may be hard to believe, but this report has been over ten years in the making. Two of us—Rebecca and Karen—became interested in issues of writing centers and diversity in 2005 after Compositionist Victor Villanueva gave an unforgettable speech at the joint International Writing Centers Association/National Association of Peer Tutoring in Writing conference that left many attendees expressing great intrigue, concern, or anxiety; and left others in complete silence. Admittedly not a “writing center person” (V. Villanueva, personal communication, Sept. 20, 2005), Villanueva went to the conference in Minneapolis with the intention of challenging conference goers. In his speech, he challenged writing center workers to consider all of the ways racism—what he called the new racism—impacts us in multiple ways, even in writing centers. The result of his challenge (which was published in the Writing Center Journal in 2006) was a flurry of postings on WCenter, a listserv for writing center directors and staff members. Many shared experiences from their own composition classrooms and writing centers where racism had emerged; a lively exchange ensued where people critically self-reflected, told of triumphs and challenges, and shared strategies with each other. Then the discussion stopped.
Before the discussion completely ended, though, one tangential conversation about what the population of writing center directors looks like emerged. Scholars talk about who (the students) composes writing centers, but how are they (the directors and staff) composed? The Peer Writing Tutor Alumni Research Project, possibly the first grassroots project to focus on the benefits of tutoring for the tutors themselves, omits many basic demographic questions (other than age and gender) from its survey. Rebecca posted her interest in exploring that very question about the population of writing center directors since many basic demographic questions were not included in the Writing Center Research Project (WCRP) survey that began in 2001 (Babcock & Thonus, 2012) and is current (at least to our knowledge) only through 2008 (Griffin, Keller, Pandey, Pederson, & Skinner, 2008). Harry Denny has recently revived the project at Purdue and has posted raw survey data from the 2014–2015 academic year. The National Census of Writing has compiled data for the 2013–2014 school year and is currently beginning data collection for the 2017–2018 academic year. The census includes questions about writing center directors in its data (Wells, 2014).1
Rebecca wanted to explore not just the race of writing center directors, but how diverse they were in multiple ways, including gender, education level and degree, first language, and (dis)ability. She and Karen vowed in a brief exchange in 2005 to return to this project—one day. In 2011, little research had yet been done and issues of diversity had become even more topical, so Rebecca and Karen reconnected, Rebecca’s then-graduate student Sarah joined the study, and the project was given life.
We know that some works in fact do explore diversity in writing centers. The ending, or “shut down” (Greenfield & Rowan, 2011, p. 2) of what became labeled the “Race and Silence” thread on the listserv in part prompted Frankie Condon, the 2005 IWCA conference chair, to write her 2007 Writing Center Journal article entitled “Beyond the Known: Writing Centers and the Work of Anti-Racism.” In addition, two writing center professionals, Laura Greenfield and Karen Rowan, were led to create and ultimately publish their award-winning 2011 edited collection Writing Centers and the New Racism: A Call for Sustainable Dialogue and Change.
While these and other works about race and diversity, such as Facing the Center (Denny, 2010), Disabled Faculty and Staff in a Disabling Society: Multiple Identities in Higher Education (Vance, 2007), “Addressing Racial Diversity in a Writing Center: Stories and Lessons from Two Beginners” (Barron & Grimm, 2002), and “Beyond the Known: Writing Centers and the Work of Anti-Racism” (Condon, 2007) encourage scholars to think critically about writing center work, many focus more on the students we serve and hire. Granted, a number of these works invite scholars to reflect upon the ways directors interact with diverse students and the methods used to engage them. Yet very few, if any, ask directors as a whole to examine the diverse make-up of their colleageues or lack thereof. One smaller side-bar conversation of the “Race and Silence” listserv thread was a question about just that: What does the population of writing center directors look like? The IWCA Diversity Initiative (2006a) clearly states that it seeks and values a “diverse membership,” and yet acknowledges the “largely homogenous composition of [its] current membership particularly with regard to race.” In addition, the initiative acknowledges the “absence of a significant body of research and scholarship addressing diversity matters in our discipline” (IWCA, 2006a). This research is an attempt to address that concern.
Many writing center works on diversity make an assumption that the reader, “the writing center director
We acknowledge Moira Ozias and Beth Godbee’s (2011) article “Organizing for Antiracism in Writing Centers” where they note that the IWCA is “racially homogenous” and “close[s] off spaces for tutors, directors, and scholars of color” (p. 169). With our study, we hoped to add empirical data to contest or validate their claims. In doing this research, we anticipated showing that writing center directors indeed are as diverse as the many clients they serve on a daily basis. Our goal was to state that writing center scholars cannot assume that writing center directors comprise a homogenous group, for many are the Other. But surprisingly, after receiving responses to our survey, we found that writing center directors are not as diverse as we believed them to be, and perhaps the stereotype of the white, female director is a fairly accurate one.
Literature Review
The relative lack of demographic scholarship on writing center directors points to the necessity of our research—writing centers still, as a field, just haven’t really dealt with diversity on a meta-level. Scholars and directors like to analyze students inside, outside, and upside-down, but haven’t turned the lens back to themselves often enough. Though not much research exists devoted wholly to writing center directors, there are some significant articles that deal with directors outright while there are also some notable texts that address directors in an oblique fashion (see Table 1).
The first survey of writing center directors was Claude F. Shouse’s 1953 dissertation. Shouse included survey questions about the director’s title, rank, and qualifications and things like lab hours and services offered. Shouse did not ask specifically about gender. All the units Shouse contacted had names that included Lab or Clinic. Shouse contacted 820 colleges and universities and received replies from 625, 110 of which had a writing laboratory or similar service. He asked these directors if they knew of labs in other locations, resulting in an additional 31 locations. Of his 60 respondents, 56 % (n=34) were at public institutions and 44% (n=26) were at private ones. Shouse found 14 different titles for the head of the laboratory. In “Time Warp: Historical Representations of Writing Center Directors,” Neal Lerner (2006) interprets Shouse’s results as indicating that 43% of writing lab directors in that survey held faculty positions (Assistant, Associate or Full) and 48% held the rank of instructor (presumably not tenure-track).2 Lerner also comments that “the terrain of our field seems separated into two types of directors, an active, enfranchised group with faculty or secure status, and a part-time, contingent–and largely silent–group doing the best they can under very difficult conditions” (p. 10). In our survey, personal comments to open-ended questions reflect this division.
Over forty years later in 1995, Dave Healy’s “Writing Center Directors: An Emerging Portrait of the Profession” focused on profiling directors in regard to academic training, gender, salary, and duties as well as job satisfaction and job perception because “if we are to understand the issue of professional status among the people who run writing centers, we need to know more about who they are and how they conceive of their own roles” (p. 27). He used the member list of the (then) National Writing Center Association and Writing Lab Newsletter to mail out his survey and hence the results are skewed toward full-time faculty or staff members who have the time and money to participate in professional organizations. Healy drew his conclusions from 348 completed surveys out of 875 sent out. His resulting demographics are as follows:
This sample indicates that writing center directors are disproportionately female: 74%. Nearly all directors (96%) have a graduate degree: 44% with a MA, 40% with a PhD, and 12% with another degree (e.g., MEd, EdD, MFA). Writing center directors are most likely to be trained in English / literature (66%), followed by education (20%) and composition/
rhetoric (10%). (p. 30)
Healy further claimed that, according to his data, “writing center directors tend to be female, are not typically trained in composition/
Healy (1995) concluded his essay by suggesting further research in stating, “it would be interesting to know how and why writing center directors entered the profession” (p. 38). He expressed interest in knowing how many directors were motivated to become directors or intended to be directors versus how many “ended up” there and if that motivation/
Healy’s article included several points that were addressed in the survey we developed. He asked the question “What is your official title?” He gave an option for “other,” as our survey did, and this generated a long list of alternate titles both for him and for us. Our survey also addressed his interest in how or why people become directors in our question “Why did you become a writing center director?” Although some of the data we collected were similar to Healy’s, we did not purposefully try to replicate his study.
Suzanne Diamond (1999) conducted an online survey of writing center directors using the WCenter listserv and asked about titles and job situations. She received 66 responses. Of her respondents, 59% were tenured or tenure-track faculty, 21% held administrative contracts, 15% were staff, and 5% were non-tenure-track faculty (n=33 had PhDs, n=2 had EdDs, n=9 did not answer, and n=19 had MAs or MFAs). Although she did not state it in the article, we interpret that the 3 not mentioned had BA degrees.
The most significant, comprehensive, and accessible research done on writing center directors is the Writing Centers Research Project (WCRP).3 The WCRP continued their surveys for several years and they unofficially published a report of their findings for the AY 2003–2004 (Griffin et al., 2008). The survey, reported in the article “Local Practices, Institutional Positions: Results from the 2003–2004 WCRP National Survey of Writing Centers” relied on the WCenter listserv, The Writing Lab Newsletter, and the Writing Center Journal for its contacts. The survey had 238 respondents (p. 27). The purpose of the survey was to “provide the writing center community with much-needed comparable data regarding operational and administrative matters. Benchmark data from a national survey can serve as an effective guide and powerful rhetorical tool for writing center directors as they make decisions about and request funds for additional space, materials, and staff wages” (p. 1). As such, the survey did not focus solely on directors, but also on tutors, clients, and locations.
The WCRP authors showed that 29% of directors have a primary program affiliation with English, 27% identified as independent, and only 12% affiliated with Comp and Rhetoric (Griffin et al., 2008, p. 6). Under the section “Who Are the Directors?” Healy’s former research was discussed and then director degree level and gender are analyzed. There were 49% who responded saying they had a PhD degree and 47% reported having an MA degree. The statistics on gender showed that 80% of the directors were female. The report also divides directors into 26% tenure track faculty, 3% part time, 15% tenured faculty, and 21% non-tenurable faculty. The data on respondents who held the job one to five years was 58% but the standard deviation of job time was 5.7 years. Salary was also addressed. Again, the article concluded with a call for further research:
The lack of a stable picture of “the writing center” supports the discussions occurring on the WCenter listserv, in the Writing Center Journal, and at conferences about the fluid nature of writing centers. While this fluid nature allows individual writing centers to change and grow to meet the needs of their particular institutions, it can also possibly restrict that growth by limiting their institutional cache [sic]. This divided position may be unavoidable, and having a typical vision of a writing center may be counterproductive, but the position merits further attention and discussion. (p. 41)
Though our survey results differ from the WCRP (again, probably due to who was surveyed and how writing centers have changed), their extensive and interesting work provides a useful starting point. However, our data tries to create a typical vision of the Writing Center director because without investigation, improvement is limited and driven by empty rhetoric.
Recently, Emily Isaacs and Melissa Knight conducted a review of 101 writing centers in the United States based on self-reported institution website available data. Their 2014 article “A Bird’s Eye View of Writing Centers: Institutional Infrastructure, Scope and Programmatic Issues, Reported Practices” focuses on the complex situation of writing program administrators in an attempt to reaffirm the importance of writing centers to the teaching of writing, yet also to demonstrate that there is a range in individual writing center goals and services and that writing centers are still marginal in the academic institution. By providing baseline data points, the authors hope to help writing program administrators lobby for more and better resources. Though Isaacs and Knight’s goals were different from ours, it was still instructive to compare our baseline data on job title, job function, and gender with their current data.
In commenting on these existing surveys, it should be noted that we could find no surveys about tutor diversity and tutee diversity, and while there are several other surveys of writing center directors, their main focus rests on how directors feel about their jobs, salaries, budgets, and needed improvements. Also, all the surveys we found—with the exception of Shouse, who compiled his own list—used pre-existing listservs or mailing addresses from professional organizations. In compiling our list of contact information, we proactively sought out writing centers to try to get to the source rather than relying on a pre-existing database.
| Table 1 Demographic Studies of Writing Center Directors |
|||
|---|---|---|---|
| Date | Author | Title | Respondents |
| 1953 | Claude Fiero Shouse | “The Writing Laboratory in Colleges and Universities” | 60 |
| 1995 | Dave Healy | “Writing Center Directors: An Emerging Portrait of the Profession” | 348 |
| 1999 | Suzanne Diamond | “What’s in a Title? Reflections on a Survey of Writing Center Directors” | 66 |
| 2001–2002 2003–20044 2005–2006 2007–2008 2014–2015 |
WCRP | National Survey of Writing Centers | 238 |
| 20135 | Valles, Babcock, Jackson | “Writing Center Directors and Diversity: A Survey” | 313 |
| 2014 | Isaacs and Knight | “A Bird’s Eye View of Writing Centers: Institutional Infrastructure, Scope and Programmatic Issues, Reported Practices” | 101 |
Several ancillary texts affirm the necessity of our work of investigating and picturing the Writing Center Director in order to achieve awareness and possibly reform.
Harry Denny provided some theory for discussing issues of writing center director diversity in his 2010 book Facing the Center. This book is mainly geared toward utilizing the writing center as a place to unravel identity politics so students and tutors can make the most of the tutoring and writing experience. However, in the last chapter he addressed writing center directors and professionals and mentioned the shifting ground of this young, emergent field by asking, “What does it mean to claim a directorship as part of one’s professional identity?” (p. 147). Denny expressed concern that the face of writing center professionals is always significant and “In a sense, these faces and their negotiations provide understanding of the ongoing dynamics of the profession and the building of a discipline that don’t have analogs in other established academic fields” (p. 151). Denny further stated his concern that writing center professionals do not understand themselves or the power they have to transform the institution and perhaps only have a surface interest in the field where they are “effective, but just don’t engage” (p. 154–155). His final words to readers offer an appeal to consider the field more deeply and more seriously by investigating identity and practices:
We professionals in writing centers intensely identify as a community, even a community of practice, but…we aren’t equipped to consider how our citizenship, in spite of its rich promise, is still deeply flawed and in need of interrogation. How do we come to think about who we allow or prohibit? How do we shunt aside specific practices and people and to what impact or effect? …Our citizenship is never fully egalitarian or equitable; our promise lies with questioning why and advocating for something better. (p. 164)
Denny’s concern about identity politics in the writing center and the effectiveness of writing center spaces further solidified our determination and decision to raise the bar and examine who writing center directors are and the need for/potential for change.
In addition, we reviewed material about higher education in general in order to give some context to our overall findings. The 2006 article “Four Barriers to Faculty Diversity” from the journal Diversity in Higher Education reports that while the student population has significantly diversified in the last 30 years, faculty composition is still predominantly white and male. A troubling figure that the authors presented was that while women (as of 2000) earned 44% of the doctoral degrees in the United States, they only represent 25% of full-time faculty at research institutions (Conklin & Robbins-McNeish, 2006). The information provided on faculty of color also leaves food for thought: “in 2003, 6.1% are Asian, 4.5% are Black and 2.9% are Hispanic” (p. 27) and roughly 85% of tenured faculty are White. The authors identified eight dimensions that contribute to racism in the academy such as “mission, culture, power, membership patterns, social climate and relations, technology, resources, and boundaries” all of which “hold an organization together and can become a powerful tool for change if those in power take effective action” (pp. 28–29). The authors then offer ideas for administrators and faculty to create an environment which motivates students of color to find a place in academia so that they, in turn, can act as role models for future students.
These same issues are repeated in the 2010 article “Diversifying the Faculty” (Taylor, Apprey, Hill, McGrann, & Wang) where the authors note that
the National Center for Education Statistics (NCES 2008) reports that just under 20 percent of the nation’s professoriate consists of persons of color—blacks/African Americans (5.6 percent), Hispanic/Latinos (3.5 percent), Asian Americans (9.1 percent), and American Indians (1.4 percent). However, data from the U.S. Census Bureau show that minority groups constitute roughly one-third of the U.S. population (Census Bureau 2009). Even more disturbing, the presence of underrepresented minorities (URMs) is less than 10 percent in certain disciplines. (p. 15)
The authors repeat the concept that while PhD attainment by URMs is rising, their placement in the academy is not parallel to said attainment. A short assessment of the success of diversity initiatives in five institutions is analyzed before the authors summarize their findings. The findings most pertinent to our research and recommendations are the authors’ thoughts that “Faculty diversity is enhanced by student diversity….Faculty diversity is enhanced by a diverse curriculum and support for research on diversity topics and issues….While financial support is important, faculty diversity is enhanced by attention to faculty/staff diversity training and campus community preparation for diversity,” and “While recruitment of diverse faculty is important, mentoring and support leading to promotion and tenure of diverse faculty hires may be more important” (p. 18).
And while faculty diversity may be growing incrementally overall, Sharon Weinberg (2008) in her article “Monitoring Faculty Diversity: The Need for a More Granular Approach” made the case that such diversity is not equally distributed among the disciplines. For instance, her research showed that Black faculty are clustered predominantly around the humanities (p. 374) and that women are still underrepresented in STEM fields (p. 381)6. To remedy the clustering effect, she also called for, as did the previous articles, outreach programs, funding, and awareness in the administration of the position of URM faculty. She also stresses the need to “‘figure’” the world of the academy with faculty role models for URM students so their academic aspirations can be attained and progress in diversity will continue (p. 384).
Details on Survey and Analysis
Previous surveys used existing mailing lists (Healy, 1995), sought out volunteers (Griffin et al., 2008), reached out to all institutions, asking if they had writing laboratories (Shouse, 1953), or scoured websites for relevant information (Isaacs & Knight, 2014). Since our goal was to contact as many writing center directors as possible, we decided to compile our own mailing list. We had access to the internet, which Shouse did not. We first searched the internet for lists of all higher education institutions in the U.S. by state and then searched each institution’s website for evidence of a writing center. If an institution had a center, we then looked for the director’s name and email address and for the writing center’s physical address and phone number. As an example, we searched the internet for what appeared to be a comprehensive list of institutions in each state and then looked up each institution on the list to see if it had a writing center. If the school had a writing center, we found the pertinent information and added it to our own list. With a few exceptions, only schools that had a writing center were added to our list. We did not add an institution to our list or contact them if said institution did not have a writing center. We also included learning centers at institutions that did not have stand-alone writing centers. A sideline to the need to find all writing centers in the U.S. was the re-establishment of the Writing Center Directory, now housed at St. Cloud State. However, in compiling our list we found that the directory list was already out of date and all entries had to be double-checked by hand. Subsequently, we sent our list to the IWCA to use at their discretion. This work, which took several years to complete, resulted in a list of 1,542 contacts with email addresses, more initial contacts than any other writing center survey to date.
The survey was written by the authors and contains questions related to diversity (see Appendix A for survey questions). The survey questions were formatted in a Survey Monkey survey and emailed to 1,466 unique email addresses (76 schools had multiple branches for their Writing Center and thus had duplicate email addresses, hence the difference between the 1,542 Writing Centers and the number of emails sent out). Of these 1,466 unique addresses, several had requested to not be contacted about any Survey Monkey surveys, resulting in 1,458 emails actually delivered. We sent the eight people who refused Survey Monkey communications a personal email with a link to the survey. In our cover letter, we had requested that the recipient contact us if they were not indeed the writing center director. Seventeen people contacted us indicating that they were no longer the writing center director at that particular institution and gave us the contact information of the current writing center director. We sent those people a survey and updated our list accordingly. One email came back as “out of service” and another came back with a form email: “Thank you for contacting the XYZ writing center….” A total of 313 people responded to the survey for a response rate of 21%.
We were assisted in the analysis by the Office of Survey Research at the University of Texas at Austin. In reviewing this data, the Office of Survey Research created basic frequencies and cross-tabulations with a Chi-square test. This test shows whether there are significant differences between groups but does not indicate exactly what is causing the significance. Most of the variables in our survey were nominal and not suitable to statistical analysis.
After receiving the results, we realized that we had not asked, under disability, about type of disability. Since only 10 respondents answered that they had a disability, we followed up with these 10 and asked if they would be willing to answer follow-up questions. Five agreed and four actually sent answers about type of disability and any discrimination they faced (see Appendix B for follow-up questions). One of the 10 who had indicated in the initial survey that he identified as disabled wrote back to say that he was not disabled, but retired. Another of the follow-up emails came back with an automatic response (“Dear Student: The writing center’s etutoring is suspended…”).
Results and Discussion
Here we report our major findings as compared to previous studies, as suggested research based on recommendations from previous studies, and as our new baseline data.
Comparison to Previous Studies
Items that we asked about that had also been asked about in previous studies are job function, job title, gender, education level and discipline.
Job Function
There was no single overwhelming response about job function in our study, as 56.9% (n=178) identified as faculty, 36.7% (n=115) as staff, 5.8% (n=18) as both, and 0.6% (n=2) were graduate students (see Figure 1).
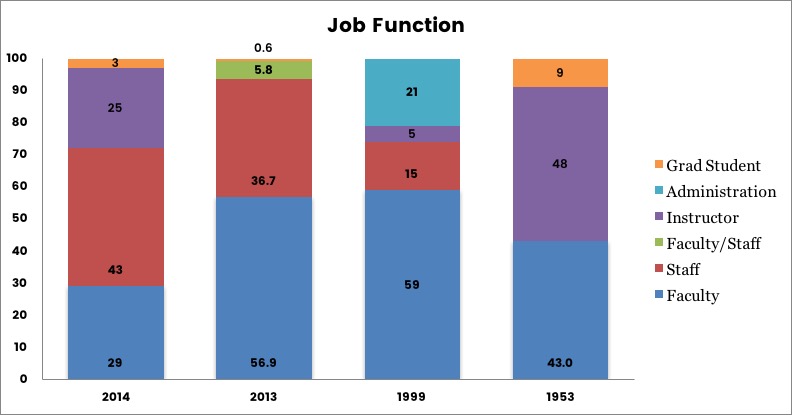
We cannot compare these results to Shouse’s, since he asked about all Lab employees, not just the director. However, this data is compared with Lerner’s 2006 interpretation of Shouse’s 1953 results (43% held faculty positions; 48% held the rank of instructor,) with Diamond’s 1999 survey (59% were faculty; 21% held administrative contracts; 15% were staff and 5% were non-tenured faculty which we considered to be instructors), and with Isaacs and Knight’s 2014 results (43% held staff positions, 29% were faculty, and 25% were non-tenured faculty which we considered to be instructors).
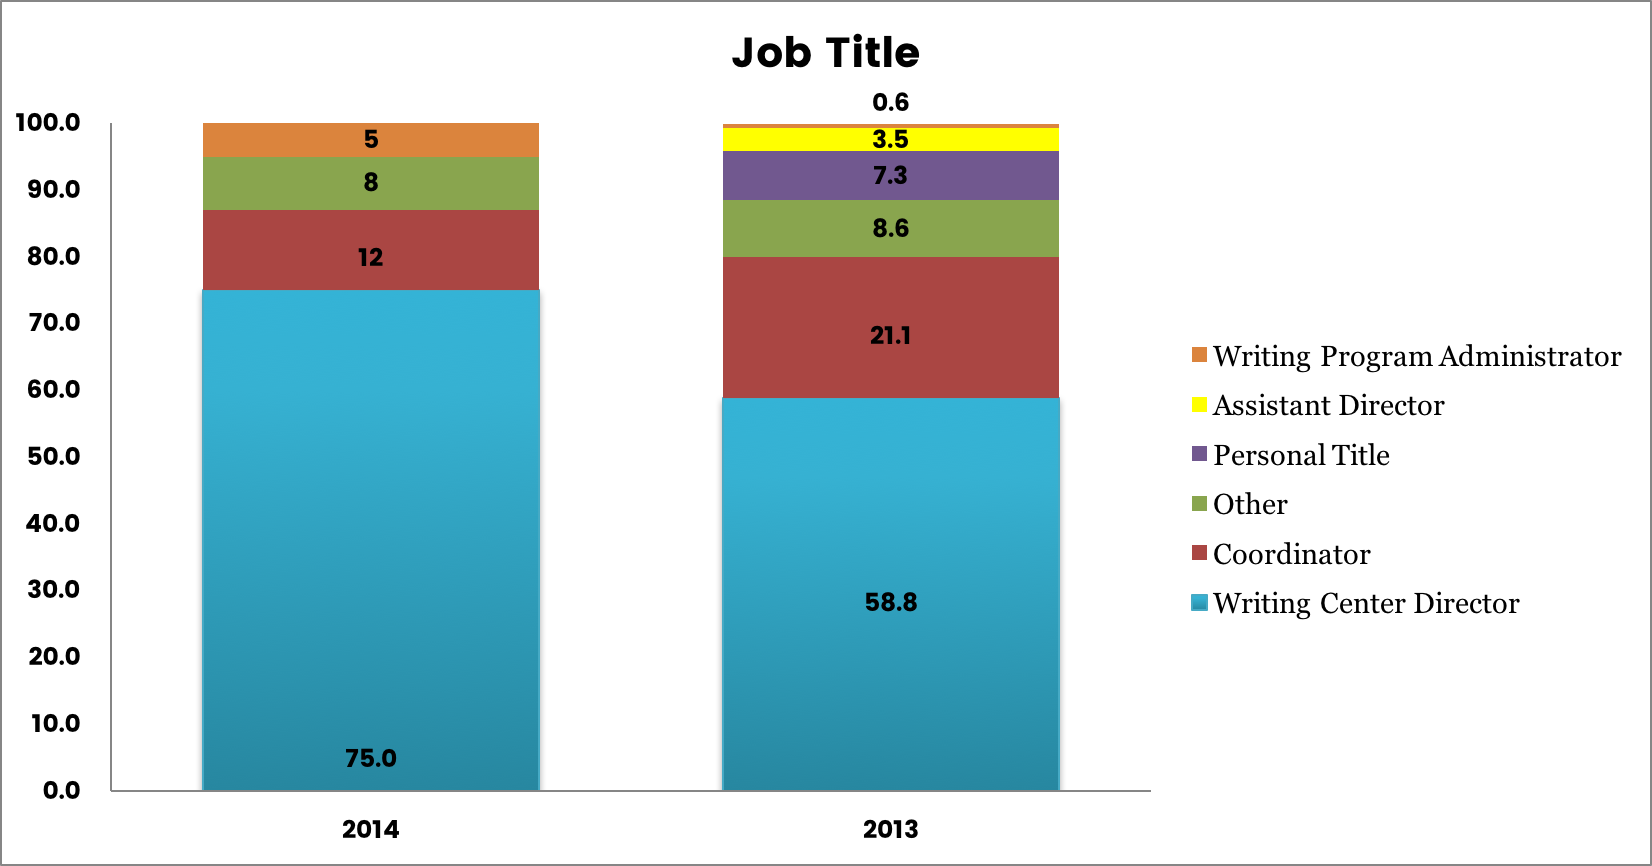
Job Title
In the same vein, as related to job title, 58.8% (n=184) were writing center directors, 21.1% (n=66) were coordinators, and the rest had varying titles including 3.5% (n=11) as Assistant Director and 0.6% (n=2) as Writing Program Administrator. Our “other” category showed that respondents identified as some other kind of director or coordinator: 8.6% (n=27) while 7.3% (n=23) respondents provided their own personal title (see Table 2). When comparing our data to Healy’s list of writing center director titles, the only titles that were the same were Director of the Writing Center, Director of Writing Across the Curriculum, Director of Learning Support Services, Writing Coordinator, and Writing Specialist. Shouse listed 14 titles, Healy had 38 titles while we had a list of 68 unique titles before recoding. Some of Healy’s titles were similar to but not exactly the same as the answers provided in our survey. It was difficult to compare our results with Shouse’s since he used mostly one-word titles but similar ones were “Director” and “Coordinator.” We were, however, able to do some comparison with the data from Isaacs and Knight which demonstrated that 75% (n=71) of respondents identified as Director, 12% (n=11) were Coordinators, 5% (n=5) stated they were Administrators, while 8% (n=8) had “No Apparent Leader.” As seen with our data, naming is still an issue in the writing center and several directors listed multiple titles since they have multiple roles to fulfill. Some directors also gave personal narrative when listing their titles such as “non-tenure track” or “Writing Center is Released Time” (see Figure 2).
| Table 2 Other Job Titles |
|
|---|---|
| Associate for the Writing, Reading, and Speaking Lab Developmental Writing, Placement, Support Supervisor English Faculty English Learning Specialist Humanities Faculty Member/Writing Specialist Instructional Associate Instructional Specialist Instructional Support Associate Interim Learning Center Manager Lab staff Lead Writing Faculty Learning Center Manager |
Learning Lab Manager Manager of the Learning Center Program Specialist Reading/Writing Coordinator Senior Professor Testing & Tutoring Center Supervisor Writing and Learning Support Specialist Writing and Reading Center Liaison Writing Center Learning Associate Writing Center Supervisor Professor of English Writing Specialist |
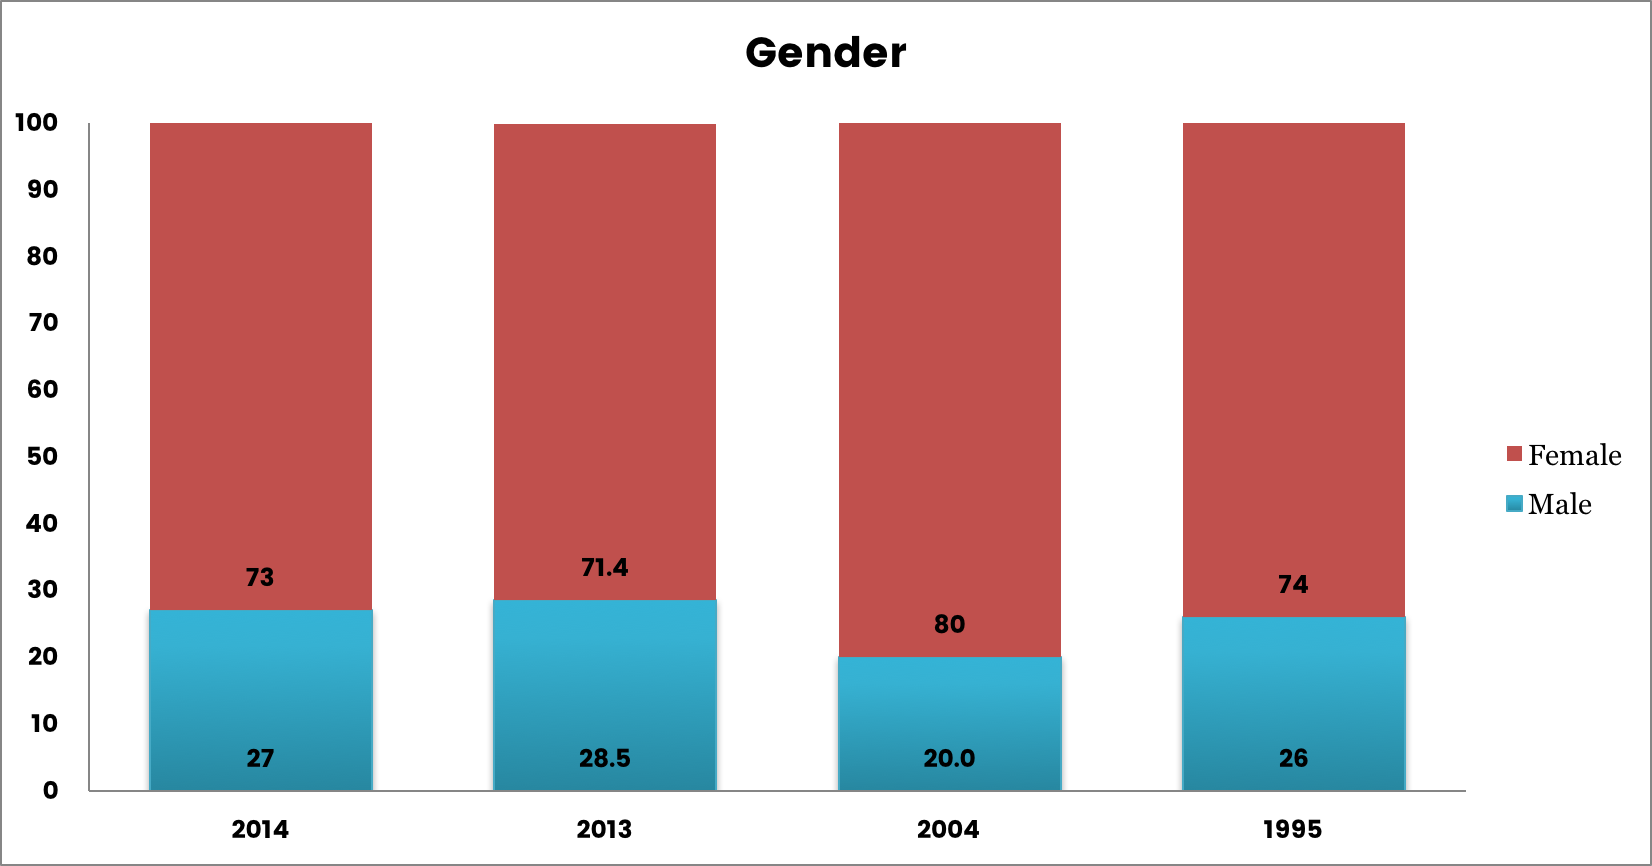
Gender
Healey’s 1995 research showed that 74% of writing center directors were female, the 2003–2004 WCRP study found 80% to be female, and Isaacs and Knight’s 2014 information showed 73% to be female. Our results found 71.5% to be female (see Figure 3 below).
Approximately 1 in 4 was male in 1995 (74% female); approximately 1 in 5 was male in 2004 (80% female); approximately 1 in 4 was male in 2013 (71% female); approximately 1 in 4 was male in 2014 (73% female).
The shifts in female to male ratios from 1995–2014 are normal fluctuations and not indicative of a trend toward more or fewer male directors. More data will be needed in future years to see if females are decreasing or staying stable. At the lower age range there are more males (43%), while as age range increase, there are fewer males (around 20%). Perhaps more males are entering the profession as directors, or perhaps as they age, they move to other jobs (see Figure 3).
Education Level.
As other researchers did, we asked about the education level of the writing center directors we surveyed. Doctorates were held by 44.4% of respondents (n=138), while 51.4% held Master’s degrees (n=160; this includes 5.1% who were ABD n=16), and 3.9% held a Bachelor’s degree (n=12). One person reported holding a PhA, a degree which we cannot identify so we class as “other” (.3%) (see Figure 4).
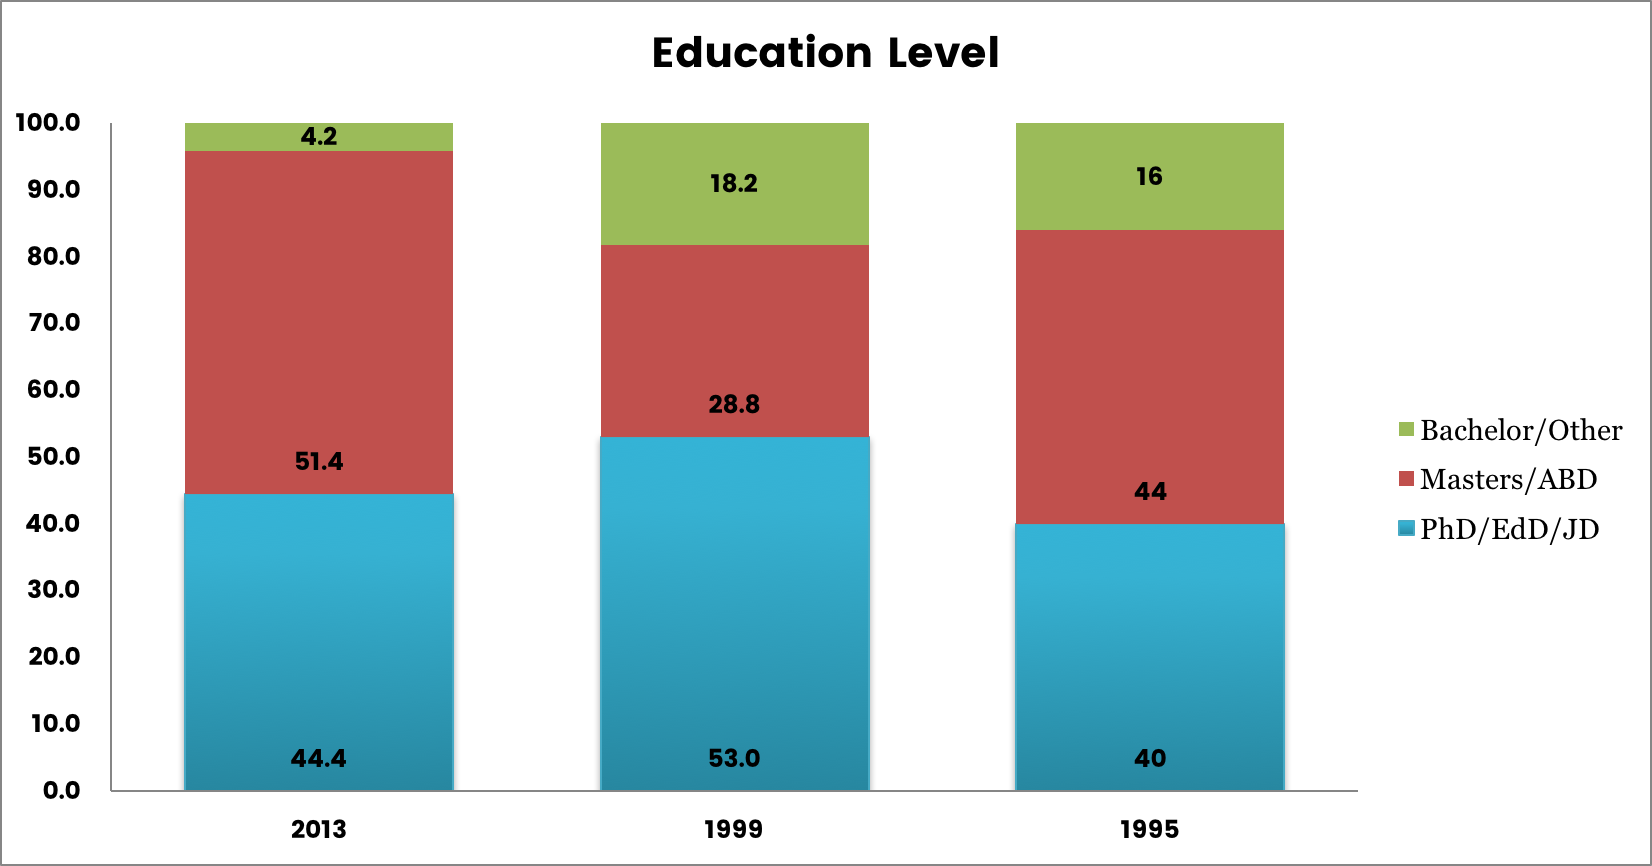
We (and Diamond in 1999) actually had more categories reported than Healy’s 1995 survey, but we combined them for purposes of comparison and analysis. See Table 3 for numerical values for each degree.
| Table 3 Numerical breakdown of degrees earned |
|
|---|---|
| PhD | 130 |
| EdD | 6 |
| JD | 2 |
| ABD | 16 |
| Masters degree | 144 |
| Bachelors degree | 12 |
| Other | 1 |
Several respondents wanted to note in the “other” field their highest degree attained as well as to acknowledge their progress towards their next degree (such as work towards a Ph.D or ABD status). Perhaps the inclusion of that information was to help them establish themselves as growing professionals. This may be connected to a lack of respect at their institutions (which is not unlikely, for many of us have heard or lived the stories of the “writing center housed in a small room in a basement”). It appears that these respondents were attempting to command more respect for their ongoing development. Compared to the numbers of degreed professionals in Healy’s (1995) survey and the WCRP (Griffin et al., 2008) there were no trends or statistical differences over time with regards to PhD vs. MA preparation of writing center directors. However, we do show many more PhDs than Shouse found. There was also no statistical correlation between degree attained and major or discipline. Given the relatively small sample sizes the margin of error is around 5 percent, so these fluctuations are to be expected and cannot really be explained by trends at this point.
Academic Discipline
The responses to the question about academic disciplines also show a variety. Thus, even at the top of writing center leadership there is no clear identity as many current directors did not seek out the position of writing center director (roughly 20%) and many are not trained in fields related to writing (42.8% trained in literature). However, our numbers regarding academic discipline are significantly different from Healy’s 1995 study in which he showed “Writing center directors are most likely to be trained in English / literature (66%), followed by education (20%) and composition / rhetoric (10%)” (p. 30). We show that that 60% studied Composition, 42.8% studied Literature, 22% noted a discipline in Education, and 8.9% demonstrated they had a background in Linguistics while other responses accumulated to 14.4%. This difference may be due to the feature in our survey that allowed respondents to check as many options as applicable, but it may also reflect changes in the writing center career track. Shouse did not ask for field of study that the respondents held, but rather what they would recommend, so we do not form a comparison with those results (see Figure 5).
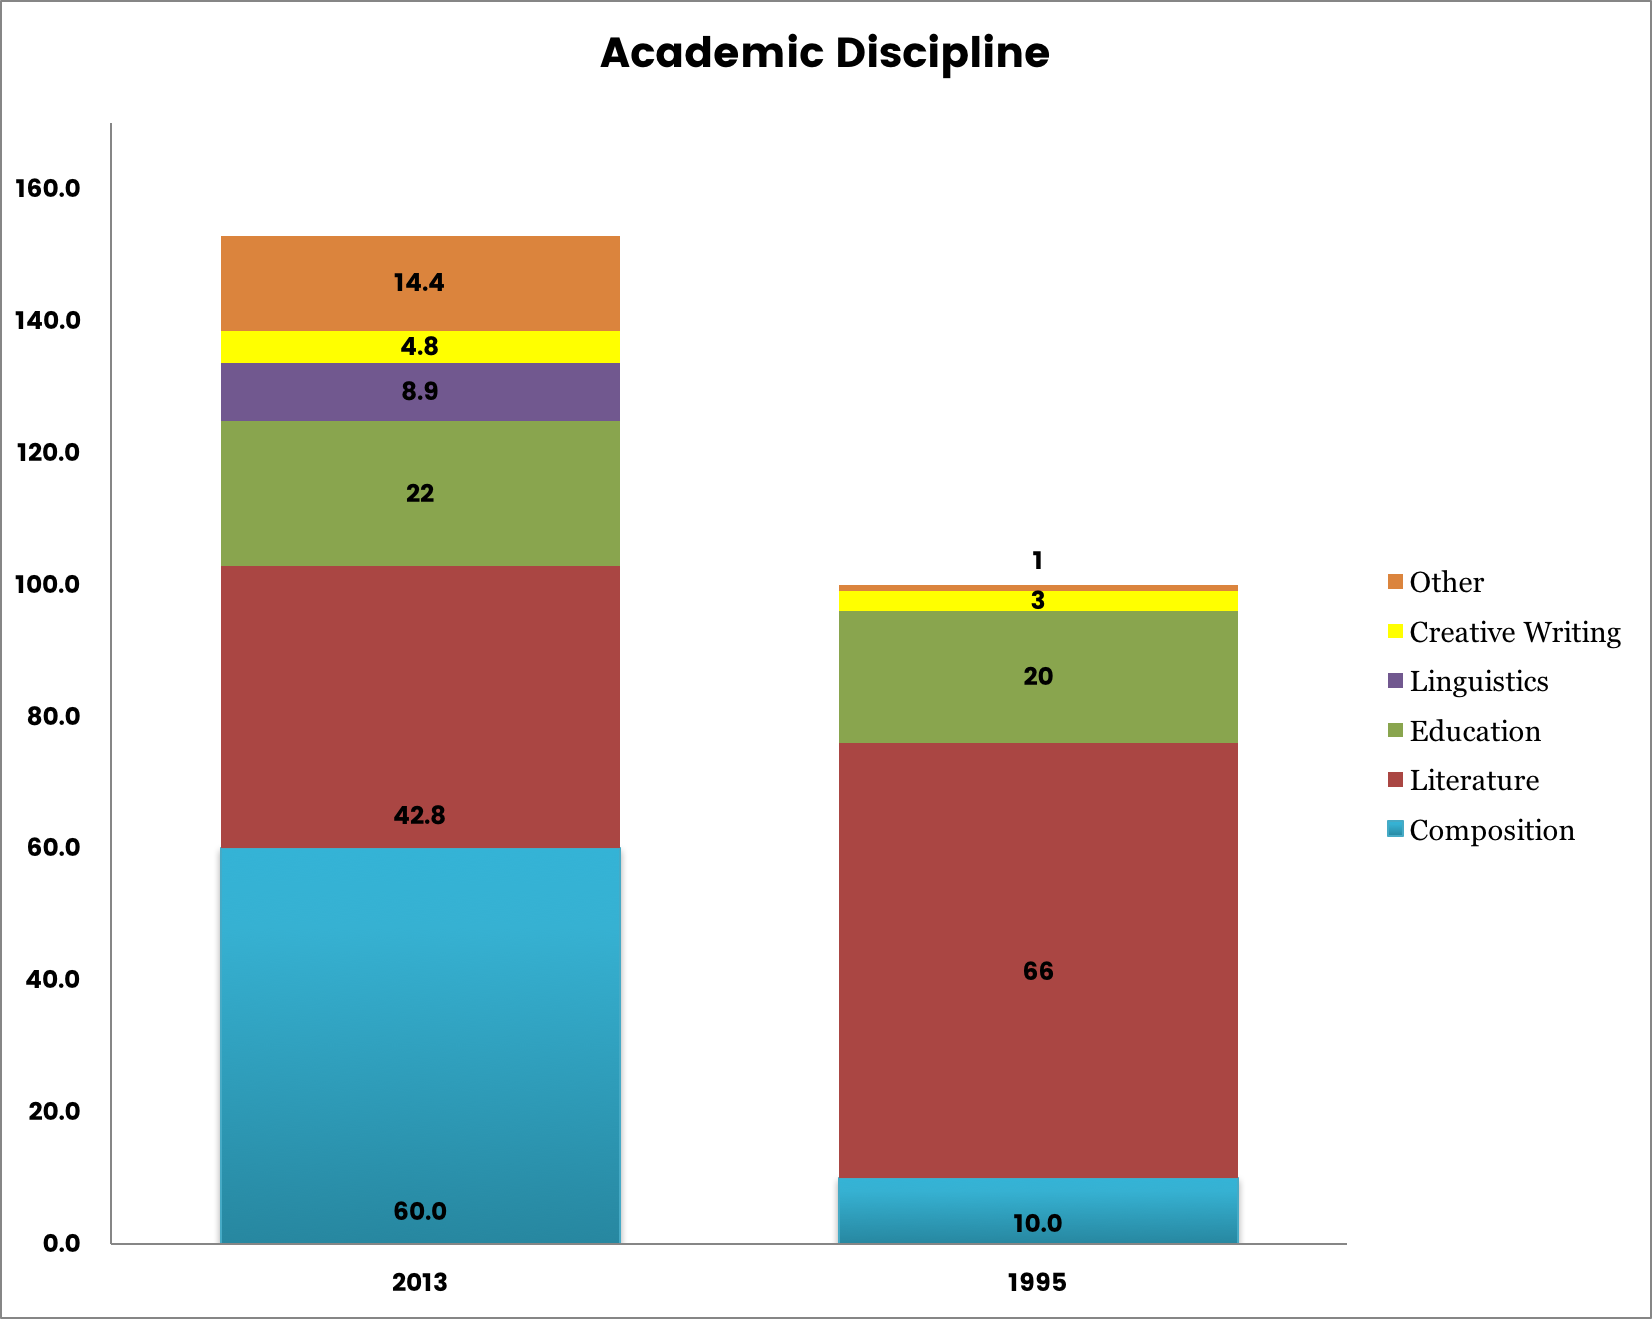
These add up to more than 100% because we allowed people to choose more than one specialty.
See Table 4 for additional disciplines.
| Table 4 Other Academic Disciplines |
|
|---|---|
| Humanities | 26 |
| Social Sciences | 12 |
| Interdisciplinary | 5 |
| STEM | 2 |
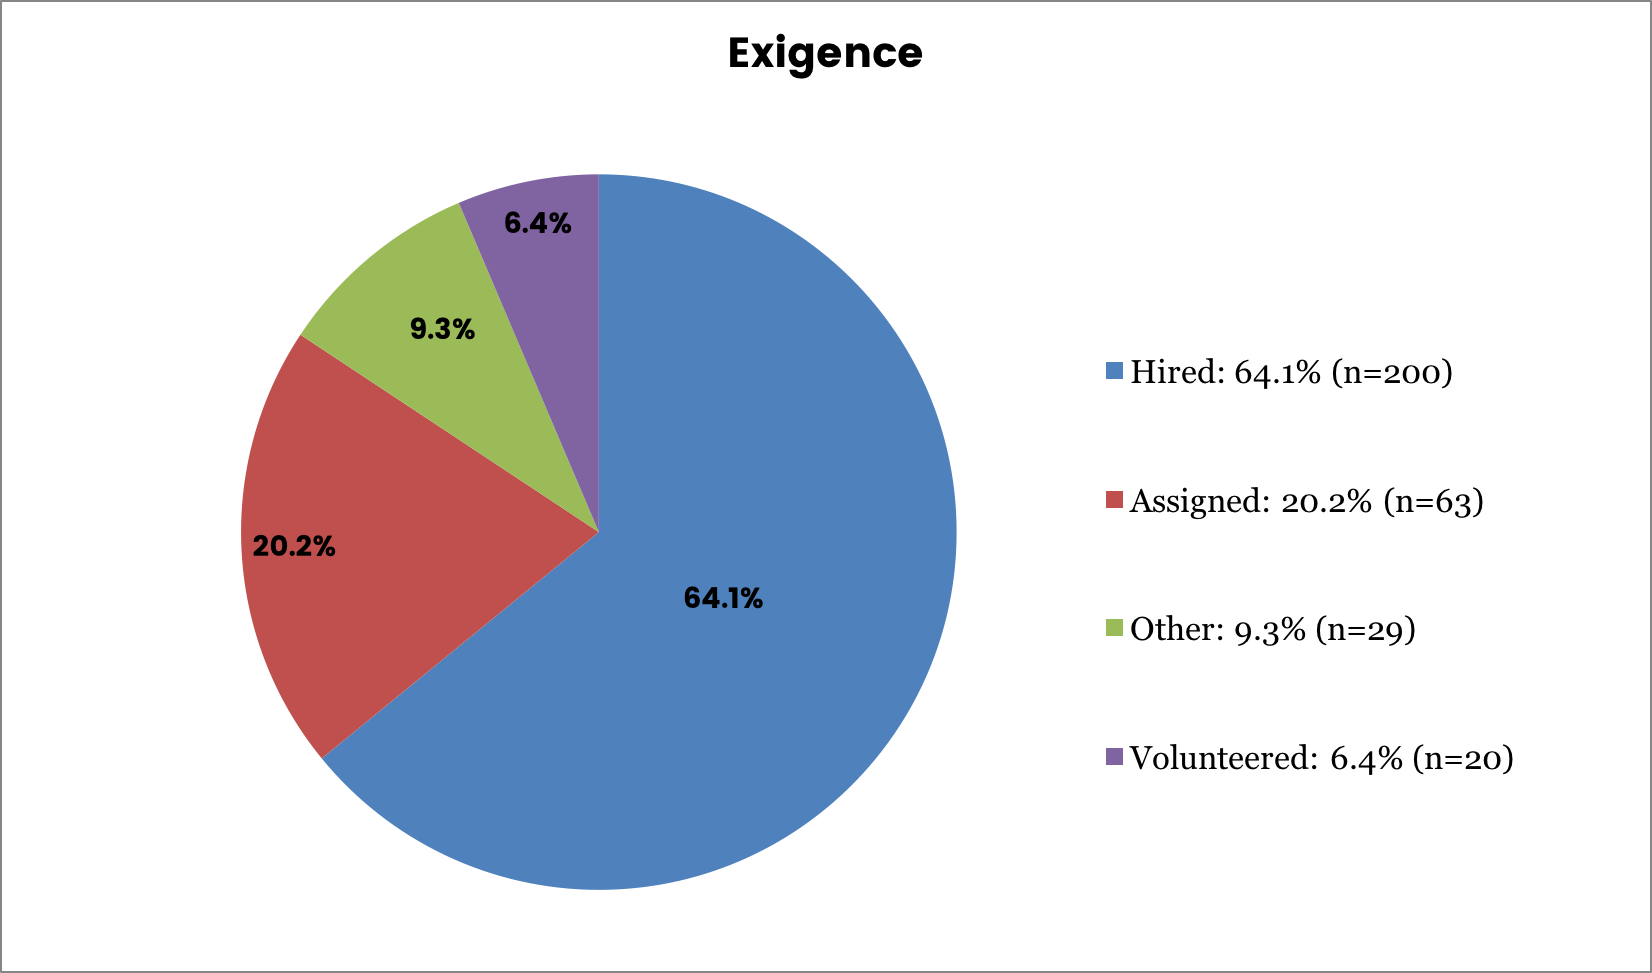
Reasons for becoming a writing center director
In his 1995 study, Healy asked for further research on why or how writing center directors find themselves in their jobs, specifically “how and why writing center directors entered the profession” (p. 38). Our survey responses reveal multiple reasons why (and how) people became writing center directors with a majority of 64.1% being hired as such (see Figure 6).
| Table 5 Other Reasons for Becoming Writing Center Director |
|
|---|---|
| Part of job description/responsibilities | 6 |
| Began as graduate assistant/part-time consultant then promoted | 5 |
| It became part of larger tutoring center | 4 |
| Took over after previous director resigned/moved to new position | 4 |
| Recruited/hired from within | 3 |
| Started/built writing center | 3 |
| Other | 4 |
New Benchmark Data
The following data are new to our study since previous studies did not ask about type of institution, age, (dis)ability, race/ethnicity or language.
Institution
Type attended as an undergraduate
Out of the responses, 88.7% (n=266) attended a four-year college, but some directors attended both a two-year and four-year college as part of their undergraduate degree (10.3%; n=31). We found it interesting that three (1%) attended a two-year college only, as presumably a Bachelor’s degree is a minimum qualification for the job of writing center director. Most of these colleges attended were public institutions 60.5% (n=158) rather than private 36.8% (n=96), with seven people (2.7%) having attended both types of institutions as an undergraduate. The geographic location of these colleges came in at 41.2% urban colleges (n=75), 32.4% suburban colleges (n=59), and 20.3% rural colleges (n=37). Smaller numbers (2% or less each) attended in multiple settings. (We did not ask about online institutions). The sizes of the colleges and universities were fairly evenly distributed at 31.7% small (n=82), 31.7% mid-sized (n=82), and 30.1% large (n=78). Again, a smattering of respondents attended different-sized institutions as undergrads, and one person had attended in all three settings as an undergrad. Very few directors attended predominantly minority institutions as undergraduates, with 1% (n=3) directors having attended Historically Black College and University (HBCU) schools, .03% (n=1) director having attended a Hispanic Serving Institution (HSI), and no directors at all having attended a Tribal College.
Type attended as a graduate student
Out of these responses, 72.9% (n=223) attended a public graduate university, 13.7% (n=42), attended a private university, and 1.6% (n=5) attended (self-defined) elite universities. Several attended more than one type of graduate institution: both public and private (5.6%; n=17), both public and elite (2.6%; n=8), both private and elite (2.6%; n=8) and three respondents (1%) attended all three types of graduate institutions.
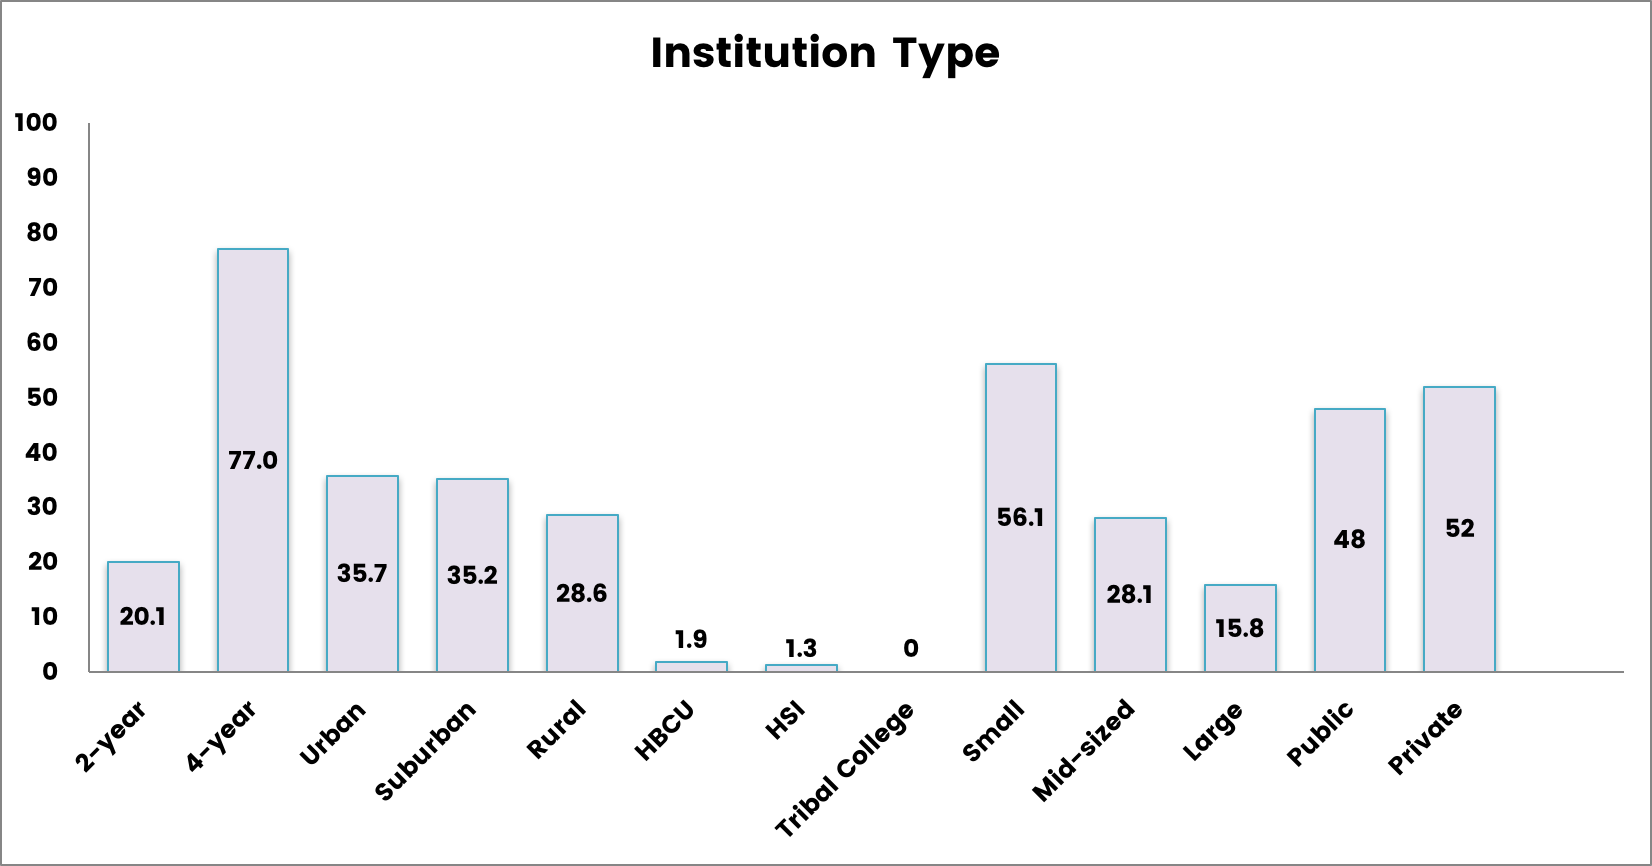
Type where currently employed
As for type of institution, 77% (n=241) who answered this part of the question reported working at a four-year college, while 20.1% (n=63) reported working at a two-year college. As for size, 56.1% (n=156) worked at small colleges, 28.1% (n=78) worked at mid-sized colleges, and 15.8 % (n=44) worked at large universities. The institution sizes were self-determined. A fairly even split occurred between public and private universities, with 48% (n=129) working at public universities and 52% (n=140) working at private universities. We did not ask about public/private or for-profit universities (44 respondents skipped this part of the question, presumably because their type of university was not mentioned). The geographic location was broken down as follows: 35.7% (n=71) urban, 35.2% (n=70) suburban, and 28.6% (n=57) rural, with one person reporting that they worked in an institution that was both suburban and rural (presumably an institution with multiple campuses). Again, we did not ask about online colleges (114 respondents skipped this part of the question, but we do not believe that that many could work at a purely online university). Minority-serving institutions were represented by 1.9% (n=6) respondents working at an HBCU, 1.3% (n=4) working at an HSI, and none working at a Tribal College.
At this point, we are unsure if we did not reach any Tribal Colleges with writing centers (at least a few were included on our list), or they did not respond to the survey. Granted, all writing center directors at minority institutions are not minorities themselves, but there does tend to be a higher concentration of them at Minority Serving Institutions (MSIs) (see Figure 7).
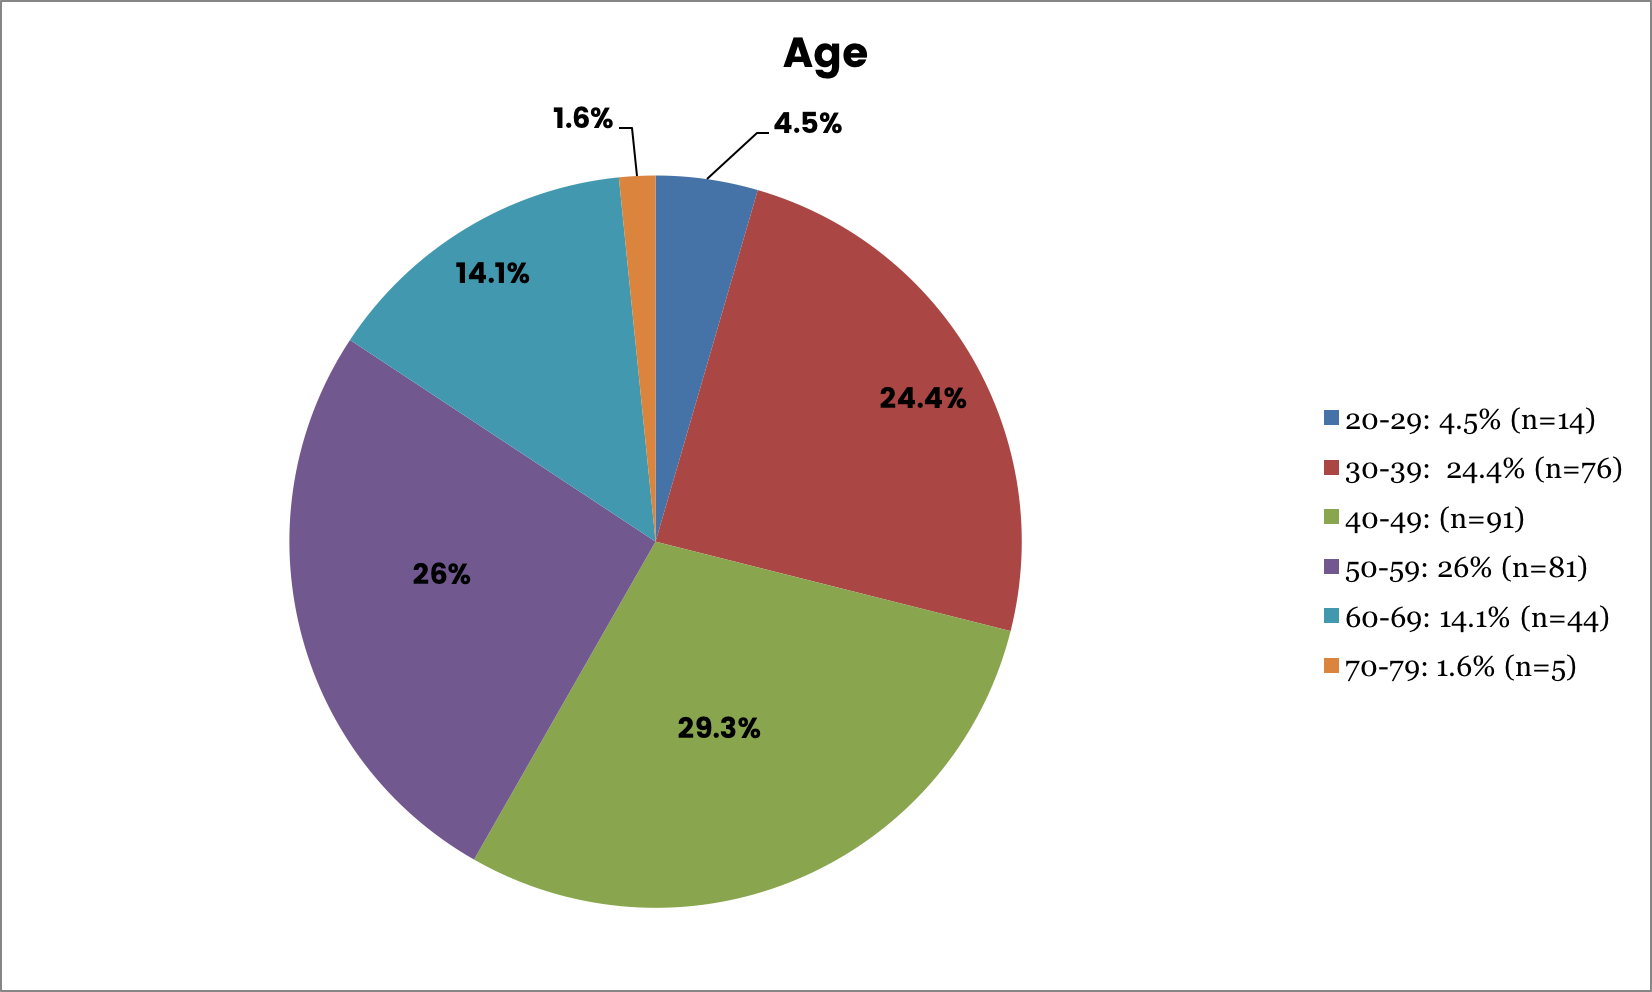
Age
The responses to the age question were as follows: 4.5% (n=14) were between 20–29 years of age, 24.4% (n=76) were 30–39 years old, 29.3% (n=91) were from 40–49, 26% (n=81) were 50–59, 14.1% (n=44) of the directors were 60–69, and 1.6% (n=5) were 70–79 years old. The mean, median and mode of responses were all in the 40–49 age group. We did not ask about ages older than 79 because we expected by that age people were retired (see Figure 8).
Language
Most respondents (96.8%) were native speakers of English. Although 10 directors indicated they were fluent in another language, only nine of these specified which language(s). Of those non-native English speakers who did specify, one spoke three languages (English, Russian and Ukranian), the others spoke Finnish, Danish, and Swedish respectively in addition to English. The languages of the five native bilinguals (in addition to English), were, Farsi (Persian), Lithuanian, Polish, and Spanish (two speakers) (see Figure 9).
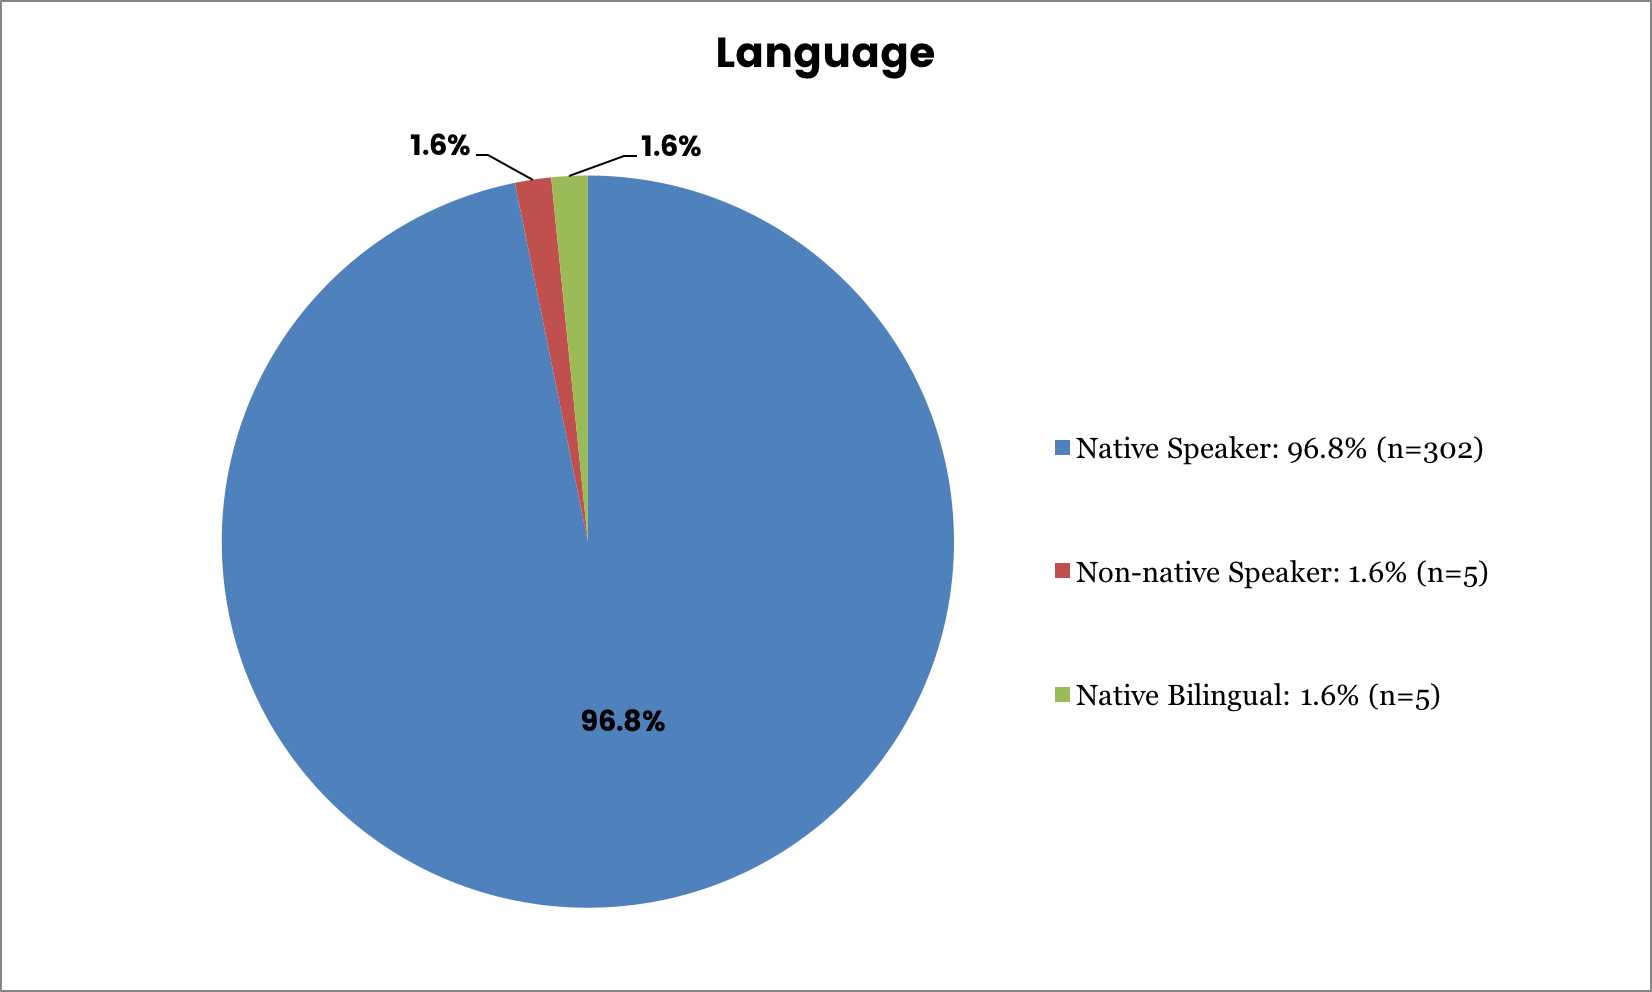
We found it interesting that only 10 of our 313 respondents reported being bilingual, and only two of these reported that they speak Spanish. We had a preconceived notion that many of our bilingual directors would speak Spanish, given the growing Latino population. Yet we found that most bilingual directors reported speaking European languages other than Spanish (the one exception being Farsi/Persian). These results suggest that race may be a factor in these cases, including the historical “acceptability” of immigrants from Western Europe as opposed to those from other areas. Prejudice and discrimination against Hispanics in terms of language is well documented (Lippi-Green, 2012).
Race/Ethnicity
The majority of respondents checked only the white box (91.3%). Twelve respondents checked more than one box (3.9%), indicating a bi- or multiracial identity. Few respondents checked African American/Black (2.9%), Hispanic/Latino (1.6%), or Asian (.3%) boxes only. One person checked all five boxes. All eight who checked the Native American box also checked the White box, and one of these chose the Hispanic box as well. Three checked both White and Asian and one checked both African American and White (see Figure 10).
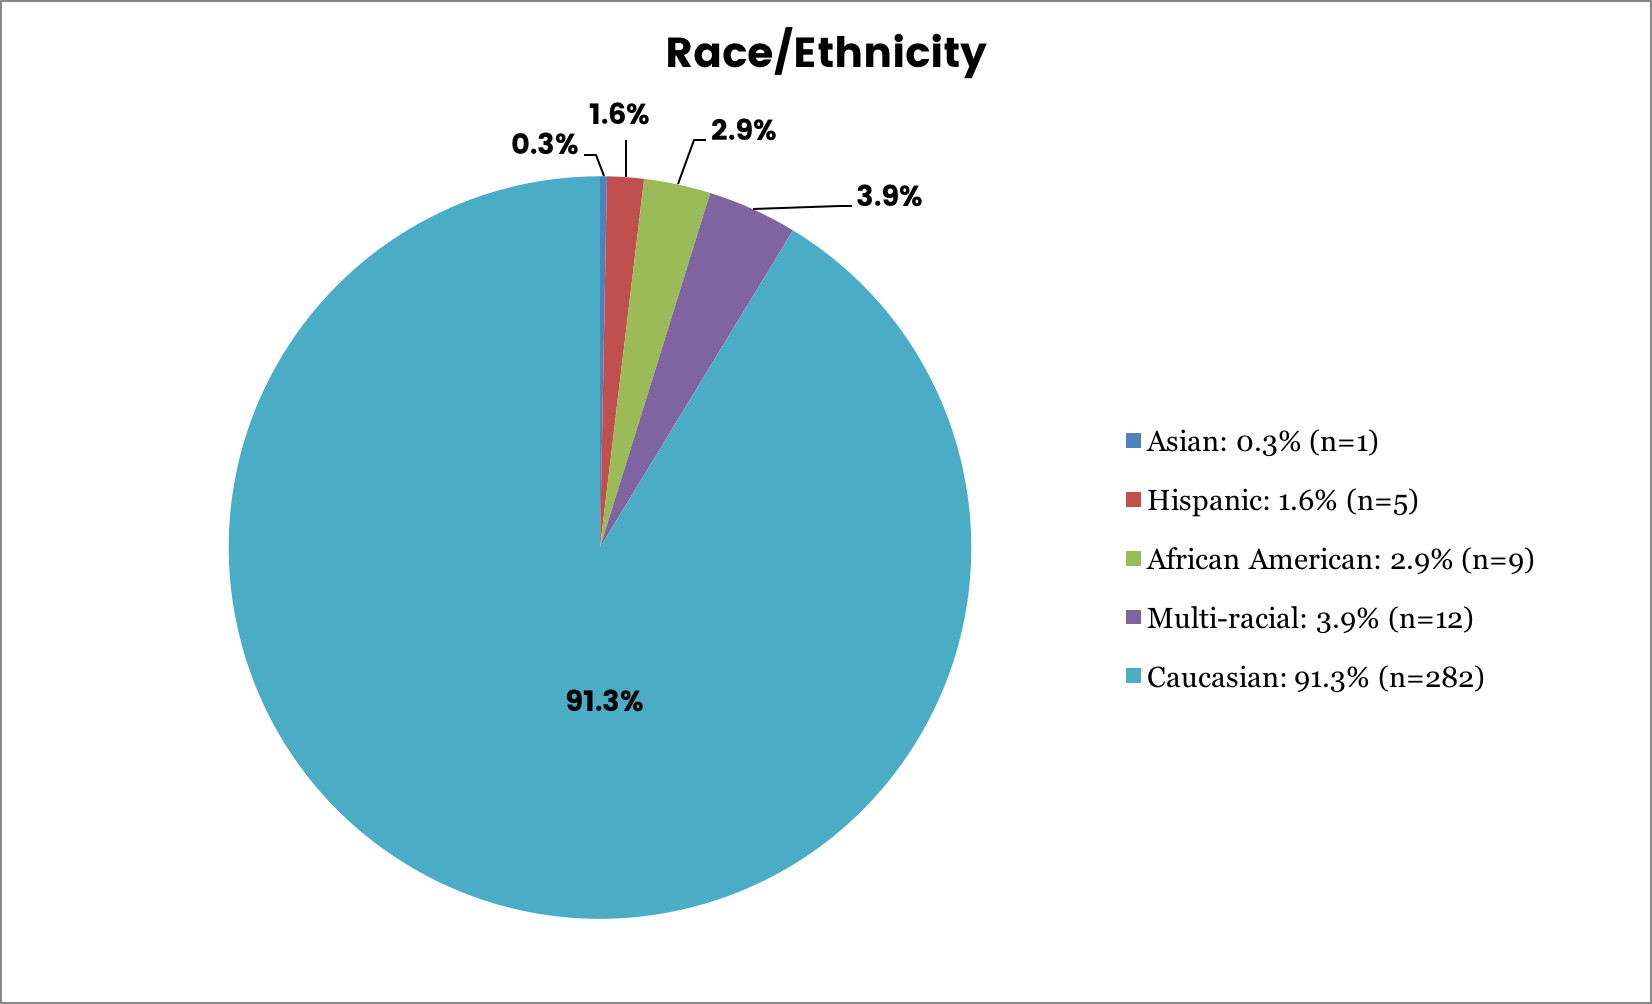
As mentioned previously, writing centers describe themselves as the safe space for all students, regardless of background or literacy practices. And yet, as our results show, very small numbers of those directing writing centers are not White. All non-white respondents equaled only 10.6% of those responding to our survey.
We had 2.9% report being African American, which is far below the 12–14% represented in our nation. Research shows that African Americans make up nearly 4% of college faculty at Predominantly White Institutions but 6.6% of college faculty when we add HBCUs to the equation (Stewart, 2012).
Similarly, the percentage of Hispanics who answered our survey (1.3%) is not representative of the percentage of Hispanics as faculty members (4%) nor of their population in the U.S., which is 16.7% (Center for Disease Control and Prevention, 2012).
The number of Asian American directors (0.3%) is far lower than the number of Asian American faculty members (6%). Xie and Goyette (2003) concluded that Asians in general gravitate toward higher paying fields than Whites. Generally, writing center director is a lower-paying job than professors of business or STEM fields.
(Dis)ability
The overwhelming majority of our respondents indicated they were not disabled (96.8%; n=302). Only 3.2% (n=10) identified as disabled. These numbers are extremely low compared to the general working population. The U.S. Department of Labor reports that as of August 2014, 19.8% of the participants in the labor force have a disability, but only 3.2% of those who responded to our survey identified as disabled.
After beginning to analyze the data, we realized we should have asked for more specifics on the type of disability. To remedy this, we sent a follow up survey to just those 10 directors who indicated they had a disability. Of these 10 directors, six responded to the request for further information. One person stated they were retired, not disabled, leaving us to assume that he or she had misread or misunderstood the question. Another director said they would be willing to respond to further questions but never sent back their answers to additional questions. This left us with answers from four directors:
- One director (D1) had a “reading processing problem.”
- One director (D2) had a form of dyslexia.
- One director (D3) had a chronic illness that affects stamina.
- One director (D4) was born without a left hand.
Regarding job discrimination, D1 stated simply “No” while D2 encountered a hostile attitude and was accused by colleagues of “copping out” and being “illiterate” when the learning disability was disclosed to them. One director (D3) alluded to perhaps indirect discrimination because of the physical demands a full-time and tenure track position seems to require while D4 took the approach that though inappropriate comments have been made, their own attitude toward the disability (“I see myself just like ‘anyone else’”) affects how people treat them in an overall non-discriminatory way. All the directors have disclosed their disability at work either because it is noticeable or because it allows for a better connection with students. However, D2 did state they only disclose their disability “under duress” because they do not want to rely on the disability as an explanation for any shortcomings.
In answering the question “How do you feel the disability interacts with or enhances your job capabilities?” all four directors replied that their disability has allowed them to experiment with diverse tutoring methods and D1 even said they preferred working with students with special needs. The responses all indicated that the directors’ disabilities have enabled them to work more effectively with students who self-identify, and two directors (D2 and D4) included some comments on how disabled or special needs students have found these directors to be inspirational to them due to the successful role the director fills.
The last two questions dealt with the IWCA conference and other conferences. None of the directors felt there were any barriers to them at the conferences, though D3 pointed out that while conferences may be a challenge for any disability, many professional organizations are working to create accommodations. All the directors stated the materials of the IWCA were accessible to them.
Sexual Identity/GLBT Status
We purposefully worded this question vaguely (“Do you identify as GLBT?”), so perhaps the six who skipped the question were not familiar with the acronym. A total of 20 respondents (6.5%) responded yes, while 287 (93.5%) responded no (see Figure 11).
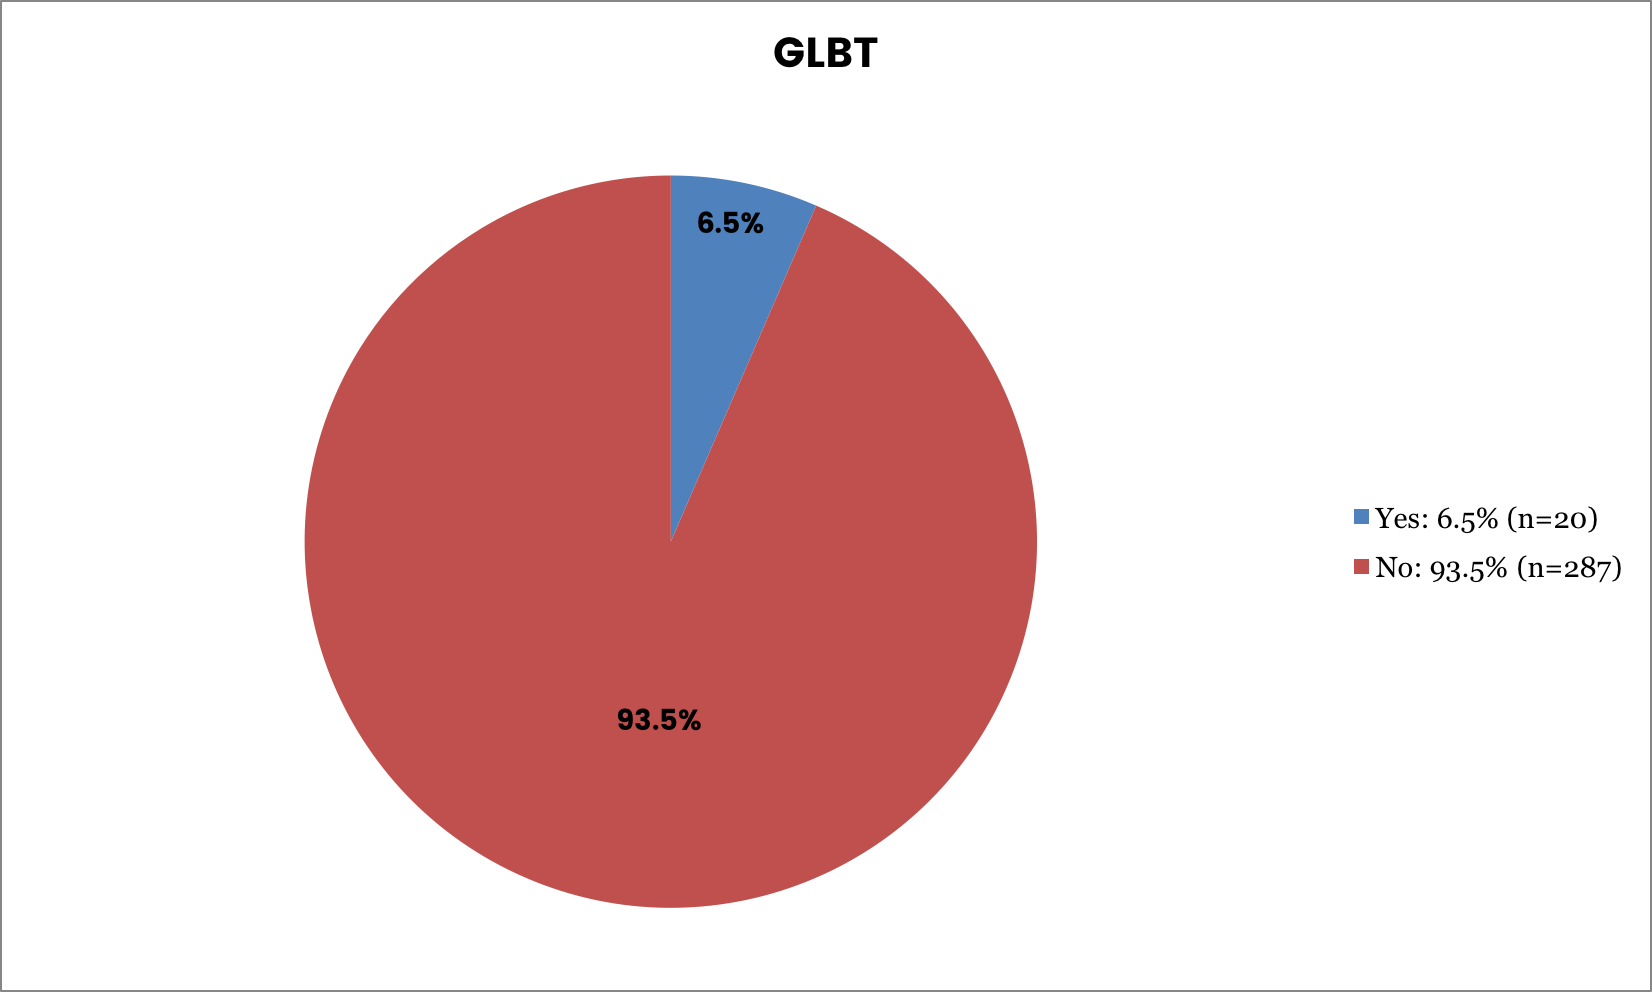
Our rate of 6.5% GLBT directors is also nearly double what we would expect compared to the general population. (Gates, 2011, concludes that the population of the U.S. is 3.5% Gay, Lesbian or Bisexual and 0.3% transgender.7)
Professional Development Activities
Professional memberships.
We had 50 directors who skipped the question. Perhaps this is a flaw in the question as we should have had a choice of “None.” Respondents could select multiple answers, however, and thus the data shows a value of more than 100%. There were 263 directors who provided responses (see Figure 12).
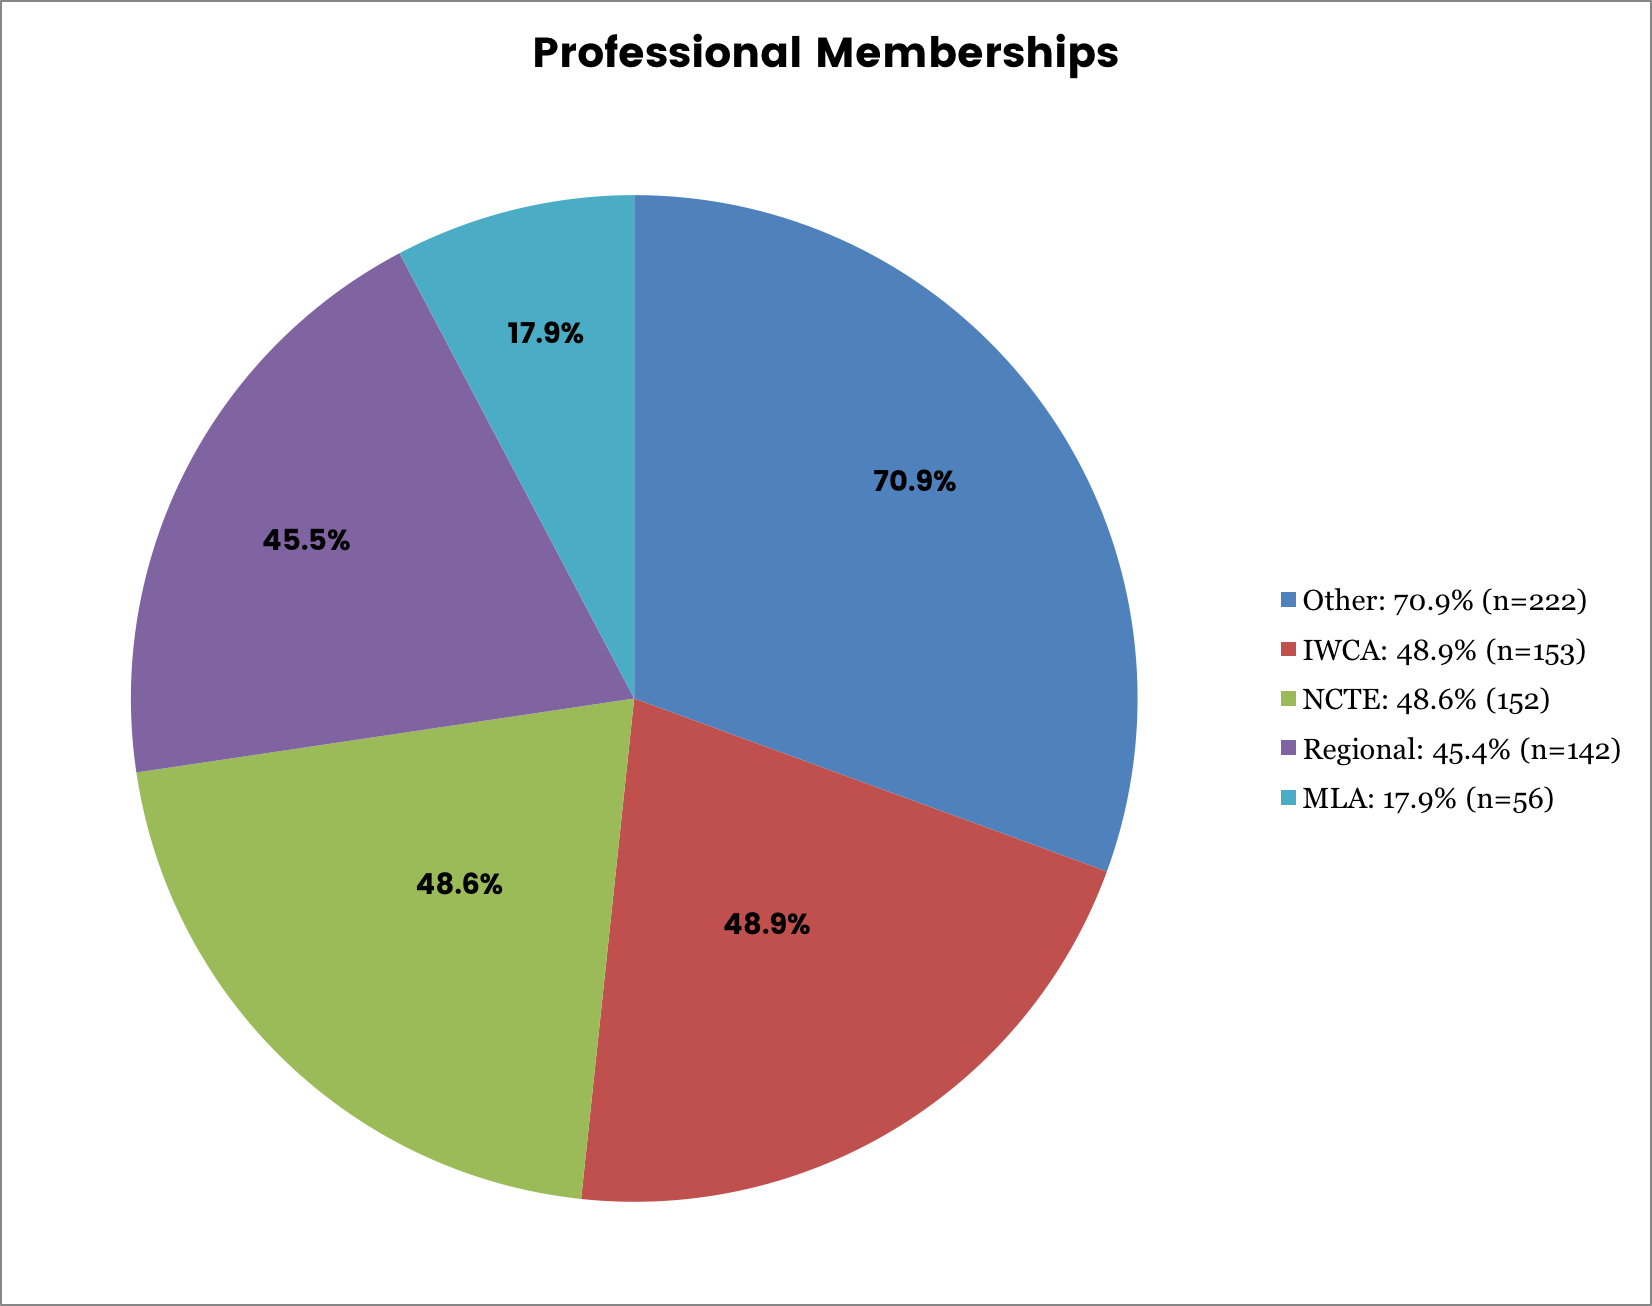
Table 6 shows other organizations, in descending order, that had more than two people declaring membership. Other groups with only one or two members ranged from international and working-class studies to literature, anthropology, rhetoric, etc.
| Table 6 Other Memberships |
|
|---|---|
| CRLA (College Reading and Learning Association) | n=19 |
| CCCC (Conference on College Composition and Communication) | n=9 |
| NCLCA (National College Learning Center Association) | n=8 |
| CWPA (Council of Writing Program Administrators) | n=8 |
| NADE (National Association for Developmental Education) | n=7 |
| AWP (Association of Writers & Writing Programs) | n=5 |
| SLAC-WPA (Small Liberal Arts Colleges – Writing Program Administrators) | n=5 |
| TESOL (Teachers of English to Speakers of Other Languages) | n=3 |
| ATP (Association for the Tutoring Profession) | n=3 |
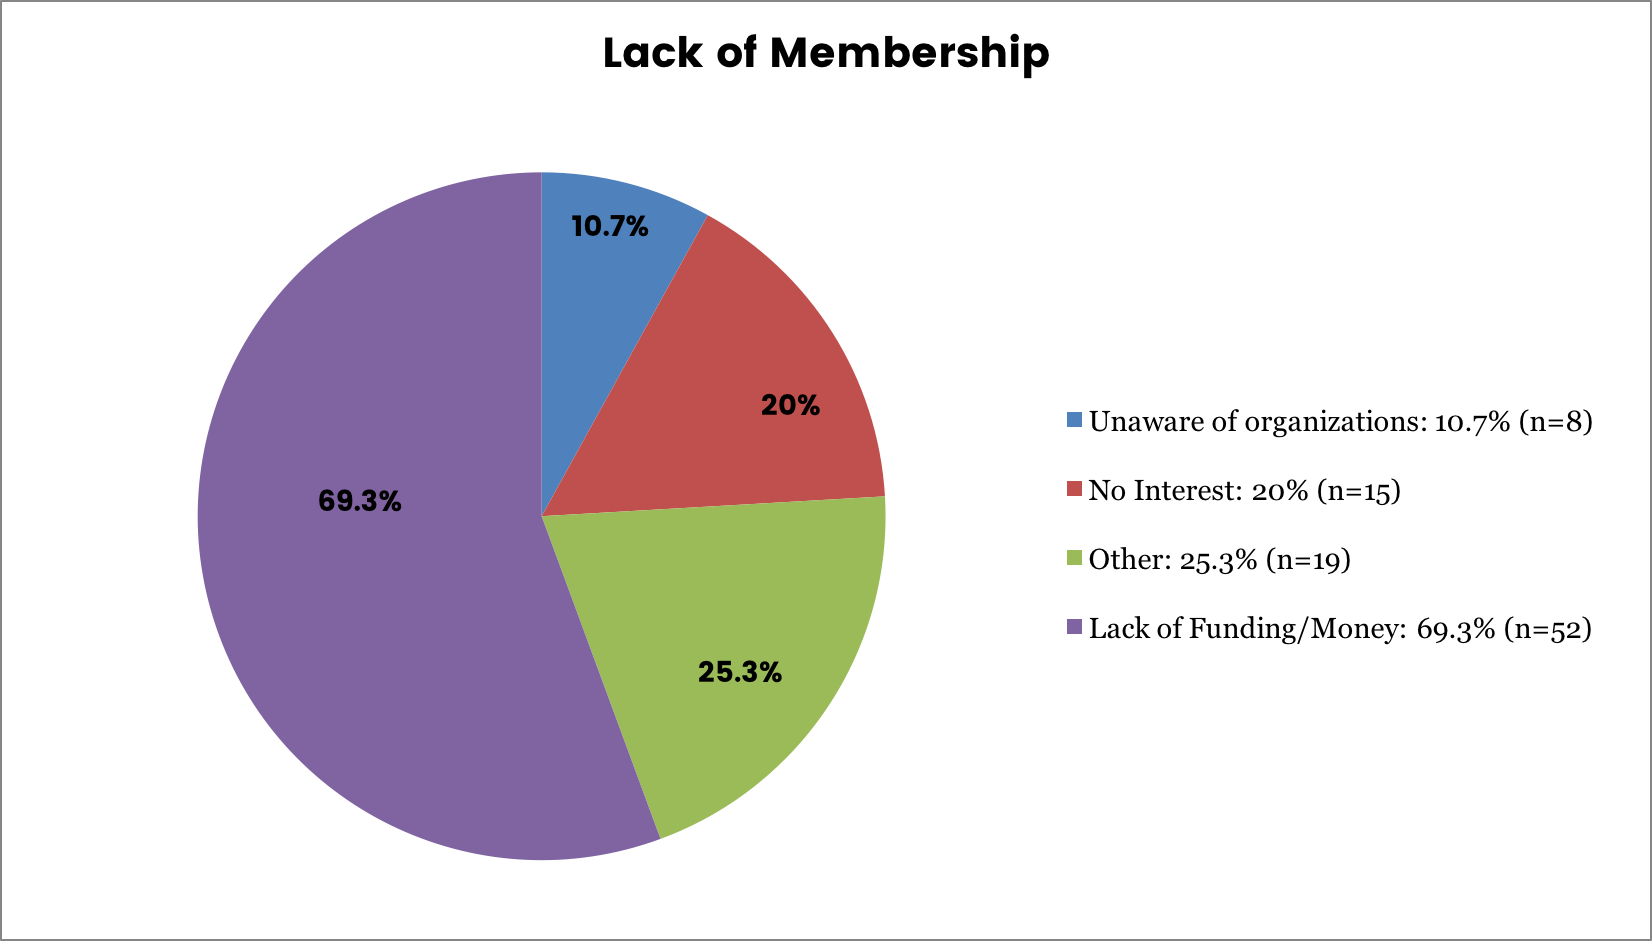
Explanations of why they are not a member
Seventy-five answered while 238 skipped the question. This question refers back to the previous question. Of the 75 responses, 69.3% (n=52) marked they did not have the funding or money to participate in professional organizations, 20% (n=15) indicated they had no interest in professional organizations, 10.7% (n=8) chose the option “Did not know about these options/organizations,” and 25.3% (n=19) inserted their own response. However, not all of these answers were reasons for not joining. For instance, one explained they had just joined IWCA and another wrote that they were a member of regional organizations. Out of those who gave reasons, lack of time was the main reason (n=7) with a related response of letting the membership lapse or just not getting around to it (n=3). Three responded that they were new to the position. Some responses were unclear, such as “part-time.” Is this a time or money or professional expectations reason? And one answered “other interest” so why did they not check “lack of interest” above? Another answered “lack of support from supervisor” but it was not clear what type of support was lacking. If it was financial support, then presumably the person should have answered lack of funds above. This same person also answered “focus on other duties” but we don’t see how this relates to not joining a professional organization, unless it returns to the “just didn’t get around to it” or “lack of time” explanations above (see Figure 13).
Conferences attended
This question asked directors to indicate what conferences they had attended in the past 10 years. Thirty-seven respondents skipped the question so we had 276 responding to the question. Respondents could select multiple answers (see Figure 14).
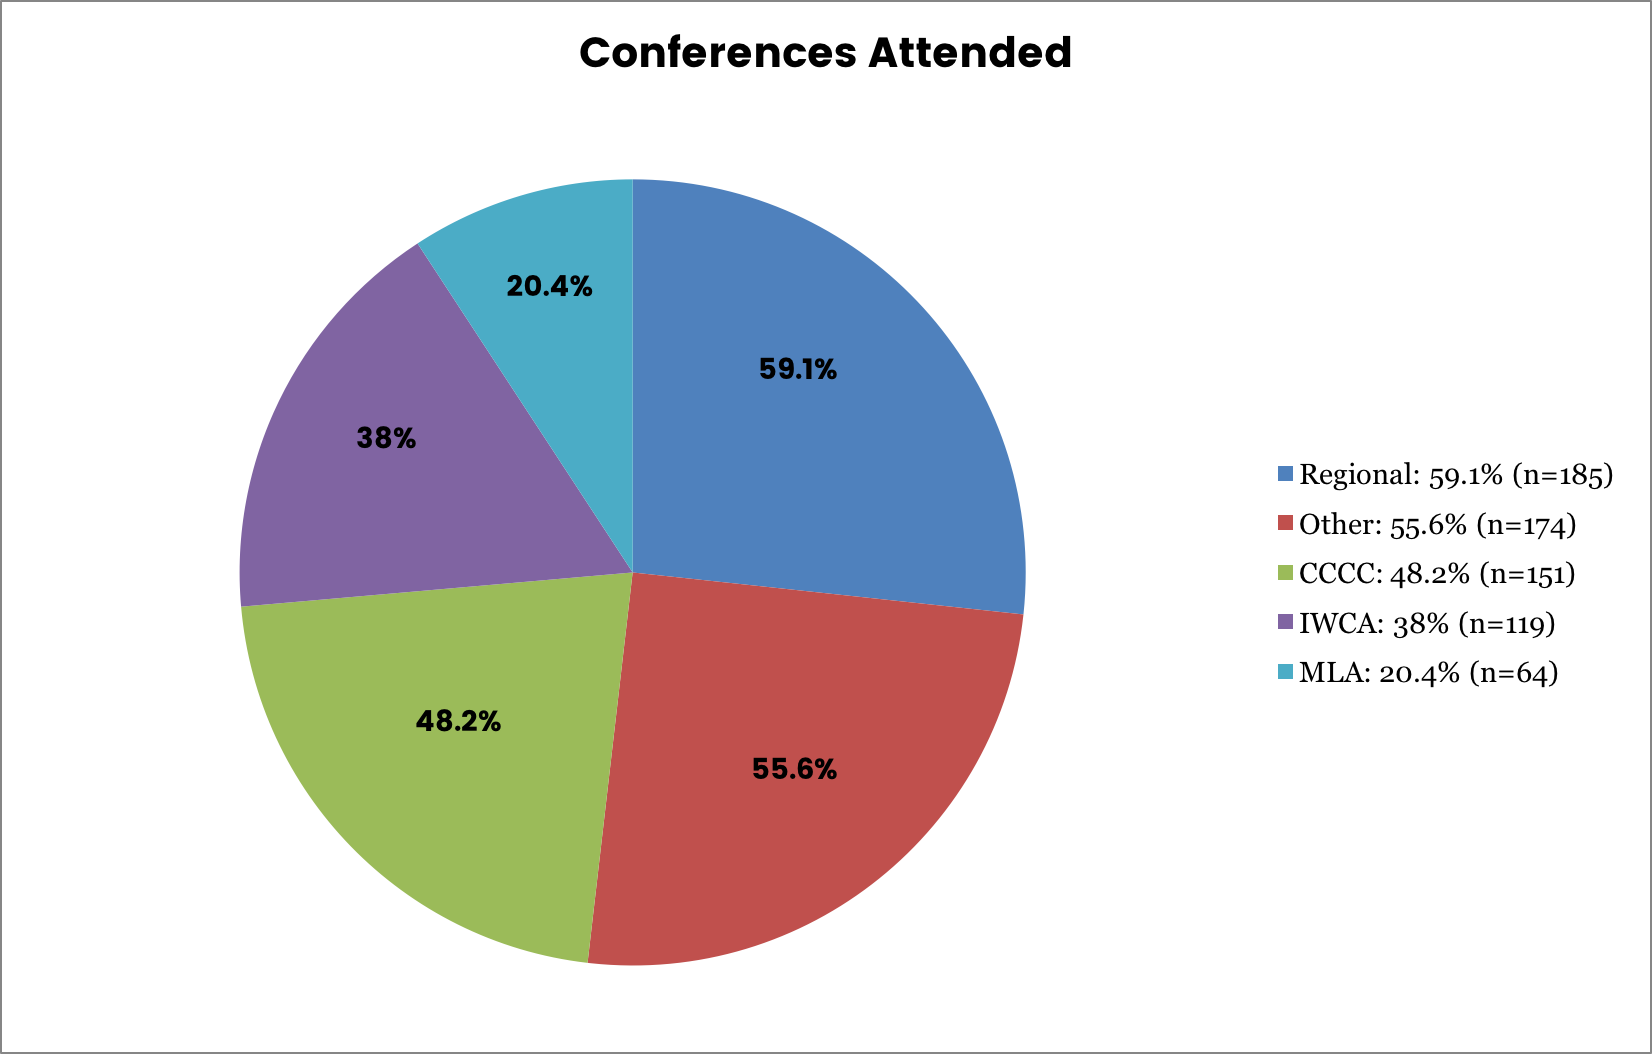
Of the respondents who indicated “other,” one person had attended at least 10 different conferences in the past 10 years! Some respondents answered without the name of the conference but just the topic, such as “linguistics” or “creative writing.” Four answered that they attended the Writing Center Summer Institute and several others mentioned workshops and other things that weren’t conferences. Table 7 shows the top “other” conferences in descending order with number of responses.
| Table 7 Other Conferences |
| NCTE (National Council of Teachers of English) (n=12) |
| CRLA (College Reading and Learning Association) (n=11) |
| NADE (National Association of Developmental Education) (n=9) |
| WPA (Writing Program Administrators) (n=9) |
| NCPTW (National Conference on Peer Tutoring in Writing) (n=7) |
| WAC (Writing Across the Curriculum) (n=7) |
| SLAC-WPA (Small Liberal Arts Colleges–Writing Program Administrators) (n=6) |
| TESOL (Teachers of English to Speakers of Other Languages) (n=5) |
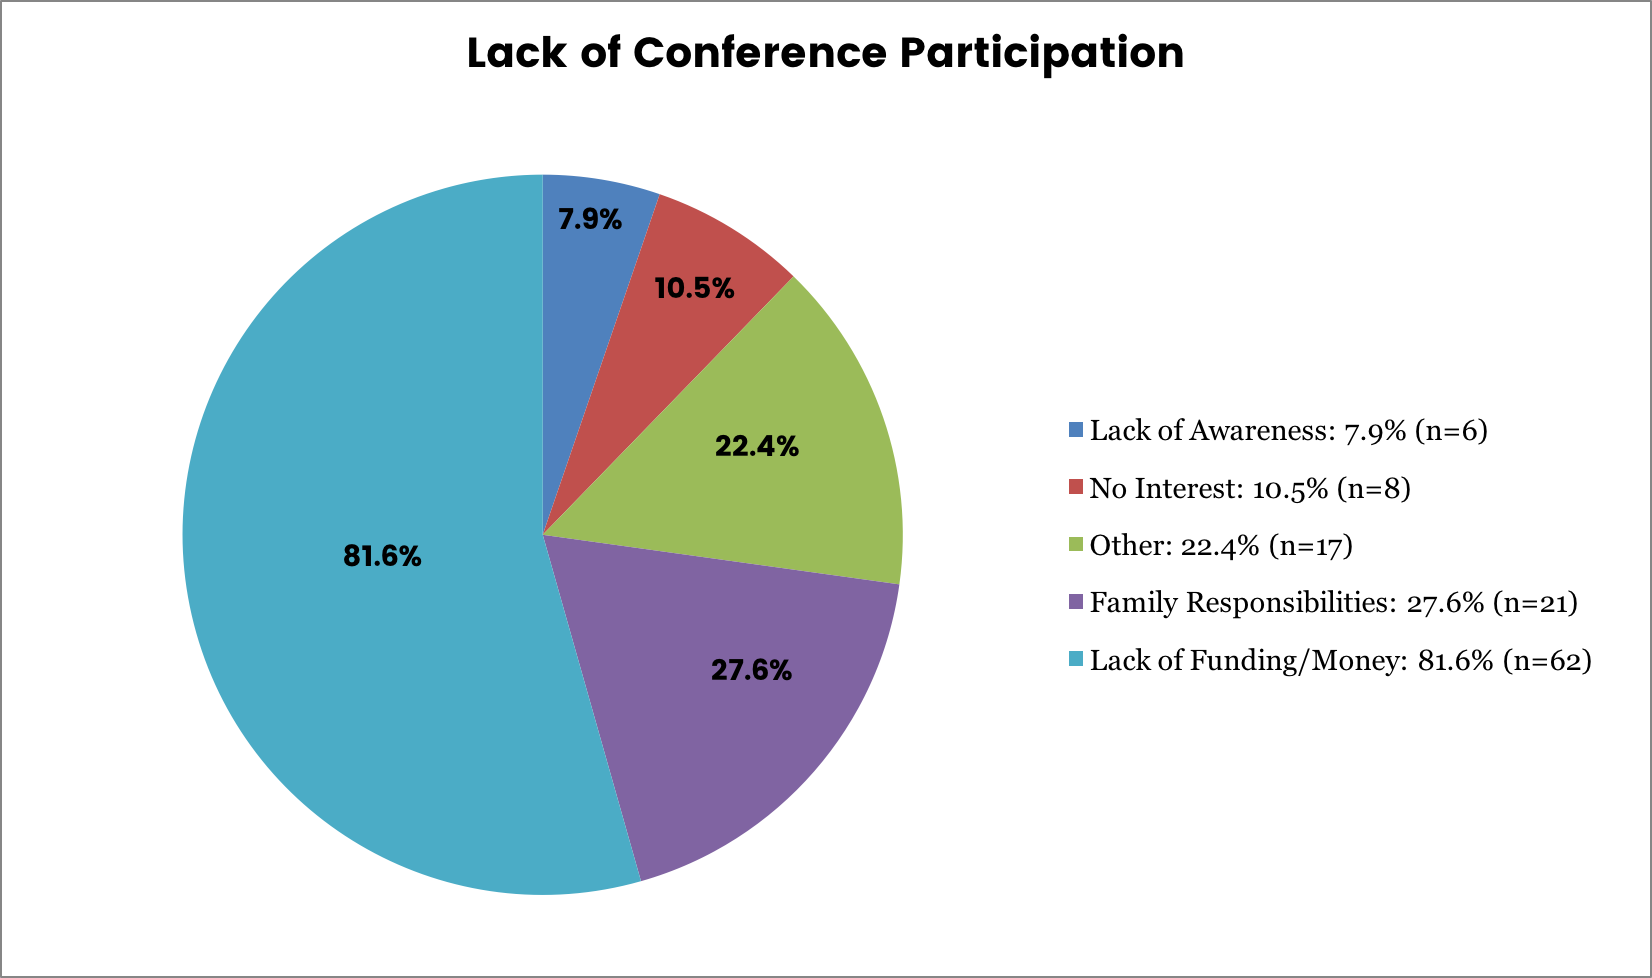
Explanation of why they do not attend conferences
Seventy-six directors answered (237 skipped the question), which is more than the number who skipped or answered “none” to the previous question. Reasons for not attending were lack of funding/money 81.6% (n=62), family responsibilities 27.6% (n=21), no interest 10.5% (n=8), and lack of awareness of the previously mentioned conferences 7.9% (n=6). Seventeen directors (22.4%) inserted their own narrative as to why they do not attend conferences. Of these “other” responses, six answered “no time/too busy”, five had just entered the field, two answered both time and money, and two others answered that health/medical issues prevented their attendance. One person did not attend because conferences seemed to rehash the same things over and over and one did not attend due to “focus on other duties” which could mean either lack of time or lack of interest (see Figure 15).
Reflections on the Study
Since this was our first attempt at a large survey, we discovered some limitations along the way. Unfortunately, in our cover letter we wrote “university writing centers” rather than “college and university writing centers” so we got several community college writing center directors asking if we wanted their response. Since six people spent several years putting together the contact list in order to include universities, colleges, and comunity colleges as well, we felt quite chagrined by this, but yes, we overlooked that and should have put “college” in the letter in addition to “university.” We regret that we did not ask about type of disability in our initial survey. A further survey could ask more specific questions about disability. Several odd or incongruous responses caused us to wonder if people read the questions carefully or took the survey with enough attention and seriousness. We did not ask about part-time or full-time status, which would have been helpful. A future study should ask this. Lastly, we later learned that body size (fat/obesity) can be considered a type of diversity and this is one area for which we did not account; neither did we inquire about religion or social class background.
We realize that, despite our best efforts in compiling firsthand as accurate a list of writing centers as possible, we did not find every single center. The lists of institutions that we found state by state were not comprehensive and thus regrettably, we missed some institutions, most specifically Minority Serving Institutions (MSIs). While there are many reasons MSIs are absent from academic/scholarly discourse (a focus on teaching/heavier teaching loads, a higher priority placed on campus and committee service, budget limitations, etc.) the fact that many were consistently absent from state institutions lists on the internet forces us to question how they are valued and perceived. Moreover, even searching within a school’s website may not have always yielded information about its writing center because quite often the information was buried or difficult to find.
We discovered in our many discussions that perhaps not everyone who works at an HSI (or other MSIs) is aware they work at such an institution, and thus our data on HSIs may not be entirely representative. The MSI category is somewhat different from HBCUs and Tribal Colleges in that there generally is no historical designation for them, but rather they are deemed as such based on the percentage of Hispanics, Asians, etc. enrolled at the institution during any given year. Theoretically, then, the designation could be fluid, making it easier for even some faculty to lack an awareness of it. Only after finishing the data collection did we learn about the designation of Asian American Native American Pacific Islander Serving Institutions (AANAPISIs). We found that, regarding HBCUs specifically, most are smaller schools where teaching (versus research) is the primary goal of the institution. Thus, that means higher teaching loads, more people wearing multiple hats (faculty member and writing center director), and often less funding for conferences and professional development. We wonder if the low response from HBCUs was related to an inability to participate in research and professional development consistently because of heavy workloads and multiple duties on campus.
The lack of diversity in terms of native English speakers and race leads us to a few thoughts:
- Perhaps non-native speakers or members of marginalized groups may be perceived as not qualified to direct a writing center (i.e. they don’t “own” Standard English as white native speakers are seen to do.)
- The lack of diversity in our survey was not only disappointing but also somewhat ironic, for Rebecca’s initial thoughts were to show that we can’t make assumptions about who directors are racially, etc. But in fact, at least in these areas, those assumptions are truths.
The diversity problem in employment is beginning to be addressed. Two of the authors have recently been contacted about recruiting diverse candidates for a writing center job. This kind of deliberate recruitment is the type of first step that will bring more diversity to these jobs.
In all race/ethnicity categories except for Native American, the percentage represented is far below the U.S. population’s average and the college faculty average; our response of 2.6% Native American directors is nearly double the percentage of Native Americans in our country (Krebs et al, 20009, report that 1.4% of the U.S. population is Native American and Taylor et al.’s 2010 “Diversifying the Faculty” article cited earlier reports that 1.4% of faculty members also are Native American). However, all our respondents who checked Native American also checked White.
The low percentage of faculty of color overall is still a concern given that African Americans make up 12–14% of the U.S. population and Latinos approximately 17%. Also interesting is that according to the U.S. Census Bureau (2012), as of 2010, 4.8% of the U.S. population is Asian, but they make up 9% of college faculty. Thus, while Asians are disproportionately more well-represented in college settings overall, they are far less represented in writing centers. Perhaps a linguistic bias against Asians results from the stereotype that their English is accented and hard to understand. Donald L. Rubin (1992) conducted a study in which undergraduates were exposed to a lecture recorded by a native speaker of English from Ohio, but were shown two photos: one of an Asian woman and one of a Caucasian woman. Although the lecture material was identical and non-accented, those undergraduates shown the photo of an Asian woman scored lower on comprehension tests and rated the speaker as having a foreign accent even though no accent was present in the recorded material. According to Lippi-Green (2012), these stereotypes can be so strong that many Americans are shocked when they encounter an Asian with an “American” accent (pp. 287–288). This perception of English incompetence may be, in part, why Asians are better represented in the Science, Technology, Engineering and Math (STEM) fields which, unlike the humanities, are not based around language. In fact, we could apply this notion of perceived linguistic incompetence to people of ethnicities such as African-American and Latino as well, for with both groups there could be a stigma that Standard English has not been mastered, whether it is believed that the African-American speaks some form of the vernacular or the Latino is a non-native English speaker who has yet to master “American” English.
In “Postcolonialism and the Idea of a Writing Center,” Anis Bawarshi and Stephanie Pelkowski (1999) argue that writing centers often remain sites of remediation and acculturation, for students are not actually empowered, but rather are taught how to successfully use existing academic discourse (pp. 47–48)8. Applying these ideas to our research, Bawarshi and Pelkowski say the university does not want what can be called “outsiders” (basic writers, under-prepared writers, those marginalized by race, class, ethnicity) to taint or “infect” the institution’s standards. This same mindset explains why so few writing center directors of color are hired in the first place. If the institution does not want these students to “infect” their standards, then certainly a director of color, someone in a leadership position, would influence the vision, the direction of an institution, as well.
Perhaps our two most exciting areas of interest were in the areas of racial diversity, or lack thereof, and disability, simply because while other types of diversity (race, class, gender, age) are studied consistently, ability often is ignored.
The low percentage of faculty of color overall is disheartening given that African Americans make up 12–14% of the U.S. population and Latinos approximately 17%. Also interesting is that according to the U.S. Census Bureau (2012), as of 2010, 4.8% of the U.S. population is Asian, but they make up 6% of college faculty.
Related to the findings regarding race were our findings that only 10 of our 313 respondents reported being bilingual, and only two of them reported that they speak Spanish.
The other surprising area was that of disability, mainly because it is an area of study that essentially has remained untapped as related to writing centers. Shigaki et al. noted in their 2012 study that 7% of faculty in higher education have disabilities; yet according to our results, only 3.2% of writing center directors have a disability. The results cause us to wonder why our percentage is so low, or perhaps if our survey was not accessible to all directors with disabilities. Perhaps directors with mild disabilities did not choose to identify as disabled, or perhaps we are witnessing discrimination against PWDs in the writing center field. Cheryl Shigaki and colleagues (2012) wrote about how they made sure that their survey was accessible to people with disabilities (PWDs) by having PWDs test it. We did not do this, so this is a weakness of our study design. Perhaps PWDs could not access the survey.
Interestingly, according to Shagaki, Anderson, Howard, Henson, & Gregg (2012), less than 1% of faculty at their home institution identified as disabled at their time of hire, yet 15% identified as disabled in their survey. Perhaps employees’ statuses changed from the time of hire to the present, or perhaps employees were afraid of discrimination at the time of hire. Cindy Bowman and Paul Jaeger (2007) discuss discrimination against people with disabilities in academic hiring. In general, they note that people with disabilities are under- and un-employed. In addition, Robert Anderson (2007) writes that disability should be considered as a minority status and that institutions of higher education are more interested in offering accommodations to students rather than to faculty. Perhaps, too, those with mild disabilities did not consider themselves disabled for the purposes of our survey. One reviewer of this article stated:
I have only recently let people at work or my students know that I have mild dyslexia and mild ADHD—perhaps in the past 8 years or so. I think I was a little afraid to say anything but I also was not fully aware that it affected my work until I learned more about the symptoms by working with more and more students with learning disabilities. Yet I don’t even think about it when I fill out surveys. I think I see ‘disability’ and think ‘major’ as opposed to ‘minor.’
These findings caused us to further probe into the types of disabilities directors reported having and if there were any correlations between disabilities and other categories, such as attendance at conferences and participation in professional organizations, but there were none to be found in the data since the values were so small.
Ideas for Further Research
Research needs to be done on the diverse make-up of tutors. After conducting a search of past studies, it was rare indeed that we found a study focusing on the demographics of writing tutors. Thus, this is an area of opportunity where one could gain a more accurate perspective of who our tutors are and types of diversity they bring to writing centers.
An additional research project could be to explore the number of current directors who were writing tutors while they were students. While no formal studies were found, we did conduct a brief informal survey on the WCenter listserv on April 2, 2013. Eighteen directors reported being former tutors themselves; one was the president of the Mid-Atlantic Writing Centers Association at the time of the survey. A deeper look at graduate students working in centers and grad students in writing programs who are working on writing center dissertations would surely be illuminating on the future of the profession.
A study could be done of the IWCA membership, looking at institutions to see how many members hail from MSIs. The “IWCA Diversity Initiative” (2006a) calls for outreach to writing centers at these institutions, but many appear to not have writing centers at all. Perhaps the IWCA could support people trying to start writing centers at such institutions. A study could be done to see what percent of HBCUs, HSIs, AANAPISIs, and Tribal Colleges do indeed have writing centers. A qualitative study could be done on just one of these groups’ writing center directors using in-depth interviews.
There is a stereotype of Asians being high-achieving academically, as there are stereotypes about African-Americans and Latinos being low-achieving academically. Research could be done on how these stereotypes affect not only hiring practices but how certain groups choose majors and degree fields. Are there fewer Asian writing center directors because Asians typically choose STEM fields? Are there cultural and family expectations about degrees and career paths that may limit participation of certain groups in humanities fields? Is the PhD (as opposed to the JD or MD) or even the MA or MFA (as opposed to MS or MBA) seen as a poor return on educational investment by some groups with more instrumental leanings?
Conclusion
Our research was undertaken in partial response to the IWCA Diversity Initiative (2006a) which notes “the absence of a significant body of research and scholarship addressing diversity matters in our discipline.” The statement also mentions the need for outreach to “Historically Black Colleges and Universities (HBCUs), tribal colleges, uninvolved high schools, two-year colleges, and colleges and universities designed to serve students with disabilities.” Also the diversity initiative says the IWCA should offer “free two-year institutional memberships in IWCA including a subscription to The Writing Center Journal to interested historically underrepresented educational institutions.” According to Shareen Grogan (personal communication, Apr. 4, 2016), “The IWCA Board is working on new position statements to address diversity needs–diversity broadly defined to include race, sexual orientation, professional status, institution type, geography, and perspectives. Our position statements outline our goals, and we are working to develop concrete ways to act on these statements. The IWCA has recently approved a budget initiative to expand travel grants so they target underrepresented groups including HBCUs and tribal colleges, high schools, contingent faculty, graduate students and members outside the US.” The IWCA has also drafted A Call for Action on Disciplinary and Cultural Diversity, 2015.
However, our survey found no correlation between race/ethnicity and IWCA membership. The diversity initiative refers to the IWCA but we compiled our list from scratch so our response or lack of should not be related to IWCA membership. (In fact, less than half our respondents were members of IWCA). It could be a factor of our database that we missed some of these institutions, or that these institutions do not have writing centers (although in the database we list some institutions without writing centers). Further research (for instance, an analysis of IWCA membership rolls) will tell us if people who work at MSIs are more or less likely to be members of IWCA. From our data the values were too low to be of use statistically.
While professional participation because of one’s financial circumstances was a focus of our research, perhaps the larger concern is that of the less-than-ideal work conditions and inadequate pay that many writing center directors receive. In July 2014, one writing center professional on the WCenter listserv posted a position for a writing center site coordinator that paid approximately $30,000 per year and the response was an uproar, to say the least. Multiple directors expressed their concern, frustration, and offense felt by the salary advertised and the required job duties. The dialogue continued for several days, ultimately with the conclusion that we need to make work conditions, including pay, more attractive so that people from all cultural backgrounds will be drawn to our field. For example, our study did not reveal a high number of Asian American writing center directors. Additional research supports these findings as often, Asian Americans gravitate towards the STEM fields, which coincidentally (or not) tend to pay much higher salaries than jobs in the arts and humanities. Perhaps an improvement in work conditions would impact these statistics.
Truthfully though, ideas for improving conditions of writing center directors is not a brand new discussion. More interestingly, we believe, is that we must not focus solely on helping writing center directors develop, but we must work on student development, more specifically undergraduate student development. For many students, by the time they even reach graduate school, they have decided upon a path of study, and often that path is not towards writing center leadership. Yet, if we can engage students at the undergraduate level, they may be more interested in staying in our field long-term. Mentoring can help, since “students of color and those from poor or working class backgrounds often face additional pressures as they seek to articulate the value (conceptual and monetary) of their work to themselves, their families, and their home communities, especially in the humanities where the use value is not necessarily self-evident” (Lopez, 2014). We can mentor students to be able to articulate these values to themselves and to those who surround them.
One way of engaging undergraduate students is through tutor training courses, which many institutions already offer. These courses expose students not only to the practical side of tutoring, but also to the theoretical and pedagogical foundations of our field so they understand that Composition and Writing Centers are legitimate fields of study in their own right. Another strategy already used by many is to increase the professional development of our undergraduate tutors. Certainly the annual NCPTW conference serves as a great way for student tutors to network and become engaged in conversations in the field. Most conferences do have scholarships, but we suggest more scholarships should be provided, especially for undergraduates and for those from underrepresented groups. Some conference scholarships go unclaimed, however, so the problem could be one of communication and outreach. For those who cannot afford to attend national conferences, even with a scholarship, regional conferences and the new surge in state-wide networks allow even more participants to have a professional experience. And if travel is completely out of the question (and for some institutions, given challenging financial climates, it is), then on-campus development can be just as beneficial. Partnering with Human Resources colleagues to conduct workshops on workplace communication, on good customer service, and on how to manage difficult clients shows tutors the larger professional context in which they work. Moreover, connecting with other offices such as Student Disabilities and the Counseling Center also provides further professional development and investment in those students who may compose the next generation of writing center directors.
We also can encourage our professional organizations to think more proactively about engaging undergraduate students. For example, the Southeastern Writing Center Association recently revised its scholarship guidelines to designate some conference travel awards to go specifically to undergraduates. In past years, scholarship awards were only separated between professionals and students. As a result, the graduate students clearly held an advantage when it came to articulating their desire for the award, their understanding of the field, and their exposure to extensive research and issues in writing center world. The Scholarship Committee felt it only fair to then revise the guidelines so undergraduate students were assured the opportunity to win awards. Perhaps full scholarships can be awarded for undergraduates from underrepresented groups (including White poor and working class students).
Lauren Fitzgerald argues that undergraduate students also should be encouraged to engage in relevant research more consistently. In her 2012 IWCA conference keynote address which was later developed into an article for the Writing Center Journal (2014), she calls on all of us to increase undergraduate research opportunities for our tutors. She explains clearly how all stakeholders—administrators, scholars, and tutors of all types—benefit from research by undergraduates in multiple ways. Recognizing work by undergraduates “offers insights into the value of helping writers, . . . puts a spotlight on the good work being done in our programs . . . [and] help[s] us map out what our field needs to consider now and where it might be headed in the future” (p. 18). And while Fitzgerald focuses on how the field can benefit, we believe that simultaneously and just as importantly, the tutors themselves benefit from conducting the research. They learn how to be scholars earlier than many of their peers and perhaps gain more confidence about their own career paths—which we hope will include more diverse students selecting, or at the very least considering, writing centers as their professional futures.
Broader research about diversity in the Humanities at the doctoral level supports the idea of focusing on undergraduate students, specifically in the form of mentorship or what the ADE Ad Hoc Committee on the Status of African American Faculty Members in English calls “affirmative activism” (Hubbard, et al., 2007) Affirmative activism includes connecting students of color at the undergraduate level with each other, with faculty of color across campus and even with those at other institutions in the same discipline (Krebs, 2010). Several resources, including Krebs’ (2010) “Doctoral Diversity in the Humanities Won’t Be Achieved by Chance” and the MLA’s 2010 report “Data on Humanities Doctorate Recipients and Faculty Members by Race and Ethnicity,” show that for students of color, especially African Americans, the majority of those who go on to earn PhDs in English attended minority-serving institutions (MSIs) at the undergraduate level. In fact, three of the top five institutions that “granted the most undergraduate degrees to [African Americans] who went on to receive doctorates in the humanities in the decade 1997–2006” (MLA 2010, pp. 1, 5) are HBCUs.
Yet, this finding should not be surprising, for HBCUs in particular pride themselves on being student-centered and committed to effective teaching. While research is of growing importance at many HBCUs, their core mission is to ensure that students are provided a quality education that inherently includes mentoring and the idea that no student is “just a number.” Smaller classroom sizes and course instruction primarily provided by faculty members themselves, as opposed to teaching assistants, characterize the idea that students at HBCUs stay connected to their instructors on a consistent basis. Thus, writing center professionals at predominantly white institutions (PWIs) can learn from MSIs’ focus on mentoring, and to encourage students of color who are English majors to specifically begin to think of the writing center as a profession.
Directors need to work from the top down and the bottom up, both to make administrators with hiring decisions aware of the need to recruit and hire diverse candidates to direct writing centers, and to hire and develop diverse tutors to work in writing centers (Valentine & Torres, 2011). Barron and Grimm (2002) discuss “Productive Diversity,” a term borrowed from literacy scholars Kalantzis and Cope to argue that literacy education must move beyond superficial multiculturalism (tolerance/assimilation/acculturation) to true pluralism where the institution itself is transformed. Directors can practice Productive Diversity and attempt to hire a staff that is diverse in regards to race, language, and able-bodiedness/disability. Judith Kilborn, as early as 1995, wrote in the Writing Lab Newsletter about her efforts to recruit a diverse staff of tutors. As a group, directors can encourage administrators and hiring committees to actively recruit PWDs, non-native speakers, Blacks, Latinos, and Asians for writing center director positions. “Finally, for change to really begin, the current leaders must learn more about their own racial and gender identities, overcome internalized (and often unconscious) racism, sexism and homophobia” (Conklin & Robbins-McNeesh, 2006, p. 29). The IWCA position statement on disabilities (2006b) indicates, “We believe that people with disabilities should be accommodated and welcomed in the writing center not only as recipients of services but also as people who work in writing centers.” The Diversity Initiative assumes a heterogeneity in the writing center (as we initially did, too) that is not reflected in the actual numbers. Writing center directors and scholars are already beginning to seek to rectify this situation but the work must continue. The writing center field can grow its own personnel: when hiring diverse undergraduate and especially graduate tutors, directors can make them aware of writing center work as a field of study and a career option. Writing center directors can themselves recruit future directors, now, as they continue to educate administrators and work for change from above.
Though we have not said it directly, it is implied throughout this work that we are advocates of diversity in writing centers. There are endless examples in nearly every professional and educational field, and in nearly all aspects of American popular culture, of the influences of diverse peoples. In his 1993 book Race Matters, public intellectual and scholar Cornel West argues that people of all races in America are interconnected, and essentially that if one goes down, we all go down together. Implicitly, then, when one race is successful, we all benefit from their accomplishments. Those ideas of the interconnectedness among the races can be broadened to suggest that our culture is enriched when we include the voices of many people with a variety of experiences.
In sum, the findings here are that writing center leadership is not as diverse as we had hoped or expected to find. Essentially, scholars and directors are more comfortable with discussing diversity as it relates to student clients and in some cases, tutoring staffs. But rarely, if ever, have writing center professionals turned the gaze back, on a meta-level, to critically analyze the composition of directors. Yet the more we considered this fact, the more we realized the lack of diversity in writing center leadership reflects a clear lack of diversity commitment on most college campuses (administration) and furthermore, reflects the complex larger cultural norms so ingrained in our society. Directors do not hire themselves, so they are not responsible for the current state of leadership. Moreover, directors can take actions to help move writing center spaces forward as new leaders enter the field.
About the Authors
Rebecca Day Babcock is the William and Ordelle Watts Professor at the University of Texas of the Permian Basin where she serves as the Chair of the Literature and Languages Department and also directs the Undergraduate Research Program. Her research interests include writing centers, disability, folk-linguisitics, and metaresearch. Her latest book is Writing Centers and Disability, edited with Sharifa Daniels, published by Fountainhead Press. She is also the author or co-author of Tell Me How it Reads: Tutoring Writing with Deaf and Hearing Students in the Writing Center, published by Gallaudet University Press, Researching the Writing Center: Towards an Evidence-Based Practice, and A Synthesis of Qualitative Studies of Writing Center Tutoring, 1983-2006, both published by Peter Lang. A second edition of Researching the Writing Center is in press.
A native of Detroit, Michigan, Dr. Karen Keaton Jackson began her academic career at Hampton University in Virginia, earning a Bachelor of Science in English Secondary Education with Summa Cum Laude distinction. She went on to receive her Master’s and Ph.D. in English Composition from Wayne State University in 2004. While pursuing her Ph.D., she was awarded a pre-doctoral fellowship at LeMoyne College in Syracuse, New York where she taught undergraduate and graduate courses on multicultural literacy. Since arriving to North Carolina Central University in 2004 as an assistant professor, she has become the Director of the Writing Studio, coordinates the campus-wide Writing Intensive Program, has served on the executive boards of the International Writing Center Association and the Southeastern Writing Center Association, and currently serves on the executive board of the Council of Writing Program Administrators. In May 2015, she received a University of North Carolina Board of Governors Award for Teaching Excellence. She maintains an active research agenda on the interrelated notions of literacy, race, and identity in the writing classroom, and more recently she has focused on composition instruction and writing centers at HBCUs and on how writing center tutorials can impact student success.
Sarah Banschbach Valles is a doctoral candidate at Texas Tech University. While her dissertation focus is on early modern British poetry and book history, her other interests and publications include writing centers, Victorian visual arts, and sci-fi Westerns. In addition to teaching freshman writing and sophomore literature, she works in the Texas Tech University Writing Center. Further, she is an active (and grateful!) participant in writing groups organized by the Graduate Writing Center. She also serves as a mentor in Texas Tech’s support program for first generation college students. She is the recipient of several competitive, institution-specific scholarships and fellowships, and serves as a board member for two different student-run organizations. Between giving tons of hugs to her children (ages 2 and 1), she reads them lots of poetry by John Milton, John Donne, and George Herbert.
References
Anderson, R. C. (2007). Faculty members with disabilities in higher education. In M. L. Vance (Ed.), Disabled faculty and staff in a disabling society: Multiple identities in higher education (pp. 183–200). Huntsville, NC: Association on Higher Education and Disability.
Babcock, R. & Thonus, T. (2012). Researching the writing center: Towards an evidence-based practice. New York, NY: Peter Lang.
Barron, N. & Grimm, N. (2002). Addressing racial diversity in a writing center: Stories and lessons from two beginners. The Writing Center Journal, 22(2), 55–83.
Bawarshi, A. & Pelkowski, S. (1999). Postcolonialism and the idea of a writing center. The Writing Center Journal, 19(2), 41–58.
Bowman, C. & Jaeger, P. (2007). Academic interviews and persons with disabilities. In M. L. Vance (Ed.), Disabled faculty and staff in a disabling society: Multiple identities in higher education (pp. 225–234). Huntsville, NC: Association on Higher Education and Disability.
Centers for Disease Control and Prevention. (2012). Celebrate Hispanic/Latino heritage month! Retrieved from http://www.cdc.gov/Features/HispanicHeritageMonth/
Condon, F. (2007). Beyond the known: Writing centers and the work of anti-racism. The Writing Center Journal, 27(2), 19–38.
Conklin, W. & Robbins-McNeish., N. (2006). Four barriers to faculty diversity. Diversity in Higher Education, 14(4), 26–33.
Modern Language Association. MLA Office of Research. Data on Humanities Doctorate Recipients and Faculty Members by Race and Ethnicity. Retrieved from http://www.mla.org/pdf/data_on_humanities_2010.pdf
Davis, L. J. (2008). Postdeafness. In H-D. L. Bauman (Ed.), Open your eyes: Deaf studies talking (pp. 314–325). Minneapolis, MN: University of Minnesota Press.
Denny, H. (2005). Queering the writing center. The Writing Center Journal, 25(2), 39–62.
Denny, H. (2010). Facing the center. Logan: Utah State University Press.
Diamond, S. (1999). What’s in a title? Reflections on a survey of writing center directors. The Writing Lab Newsletter, 24(1), 1–7.
“Diversity in Academe: 2011: Data on Doctorates, Students, and Faculty.” Chronicle of Higher Education, 58(6), B43–B46.
Fitzgerald, L. (2014). Undergraduate writing tutors as researchers: Redrawing boundaries. Writing Center Journal, 33(2), 17–36.
Gates, G. J. (2011). How many people are lesbian, gay, bisexual, and transgender? Williams Institute, UCLA School of Law. Report. Retrieved from http://williamsinstitute.law.ucla.edu/app/uploads/Gates-How-Many-People- LGBT-Apr-2011.pdf
Greenfield, L., & Rowan, K. (2011). Writing centers and the new racism: A call for sustainable dialogue and change. Logan: Utah State University Press, 2011.
Griffin, J. A., Keller, D., Pandey, I., Pederson, A.-M., & Skinner, C. (2008). Local practices, institutional positions: Results from the 2003–2004 WCRP national survey of writing centers. Writing Centers Research Project. Retrieved from http://coldfusion.louisville.edu/webs/a-s/wcrp/reports/analysis/WCRPSurvey03-04.doc
Healy, D. (1995). Writing center directors: An emerging portrait of the profession. WPA: Writing Program Administration, 18(3), 26–41.
Hubbard, D., Krebs, P., Laurence, D., Lee, V., Steward, D., & Warhol, R. (2007). Affirmative activism. Profession 2007, 150–155.
International Writing Centers Association. (2006a). IWCA diversity initiative. (IWCA Position Statements). Retrieved from http://writingcenters.org/app/uploads/2008/06/iwca_diversity_initiative1.pdf
International Writing Centers Association. (2006b). Position statement on disabilities and writing centers. (IWCA Position Statements). Retrieved from http://writingcenters.org/app/uploads/2008/06/disabilitiesstatement1.pdf
Isaacs, E., & Knight, M. (2014). A bird’s eye view of writing centers: Institutional infrastructure, scope and programmatic issues, reported practices. Writing Program Administration, 37(2), 36–67.
Kilborn, J. (1995). Cultural diversity in the writing center: Defining ourselves and our challenges. Writing Lab Newsletter, 19(1), 7–10.
Krebs, P. (2010). Doctoral diversity in the humanities won’t be achieved by chance. Chronicle of Higher Education, 57(5), B28–B31.
Krebs, P. M., Ardis, A. & Perelmuter, R. (2009). Summer schools: Coordinating programs to address underrepresentation among humanities doctorates. Profession 2009, 365–372. doi: 10.1632/prof.2009.2009.1.365
Lerner, N. (2006). Time warp: Historical representations of writing center directors. In C. Murphy & B. L. Stay (Eds.), The writing center director’s resource book. (pp. 3–11). Mahwah, NJ: Lawrence Erlbaum.
Lippi-Green, R. (2012). English with an accent: Language, ideology and discrimination in the United States. (2nd ed.). London: Routledge
López, M. (2014). On mentoring first generation and graduate students of color. Committee on the Literatures of People of Color. Modern Language Association. Retrieved from http://clpc.commons.mla.org/on-mentoring-first-generation-and-graduate-students-of-color/
Milchus, K., & Grubbs, R. L. (2007). Work experiences of educators with disabilities. In M. L. Vance (Ed.), Disabled faculty and staff in a disabling society: Multiple identities in higher education. (pp. 243–251). Huntsville, NC: Association on Higher Education and Disability.
Ozias, M. & Godbee, B. (2011). Organizing for antiracism in writing centers. In L. Greenfield & K. Rowan (Eds.), Writing centers and the New Racism: A call for sustainable dialogue and change. (pp. 150–174). Logan: Utah State University Press.
Rubin, D. L. (1992). Nonlanguage factors affecting undergraduates’ judgments of nonnative English-speaking teaching assistants. Research in Higher Education, 33(4), 511–531.
Shigaki, C. L., Anderson, K. M., Howard, C. L., Henson, L., & Gregg, B. E. (2012). Disability on campus: A perspective from faculty and staff. Work, 42(4), 559–571.
Shouse, C. F. (1953). The writing laboratory in colleges and universities (Doctoral dissertation, University of Southern California). Retrieved from http://comppile.org/profresources/ShouseDiss.pdf
Smith, E. (2012). Making room for fat studies in writing center theory and practice. Praxis: A Writing Center Journal, 10. Retreived from http://projects.uwc.utexas.edu/praxis/index.html/index.php/praxis/article/view/94
St. Cloud State University. (2012). The writing center directory. Retrieved from http://web.stcloudstate.edu/writeplace/wcd/index.html
Stewart, P. (2012, July 19). After decades, revolving door remains for Black, Latino scholars in the academy. Diverse: Issues in Higher Education. Retrieved from http://diverseeducation.com/article/17227/
Taylor, O., Apprey, C. B., Hill, G., McGrann, L., & Wang, J. (2010). Diversifying the faculty. Peer Review, 12(3), 15–18.
U.S. Census Bureau. (2012). The Asian population: 2010. 2010 Census Briefs. Retrieved from http://www.census.gov/prod/cen2010/briefs/c2010br-11.pdf
U.S. Department of Commerce. U.S. Census Bureau. (2012). Occupations of the employed by selected characteristics (Report No. 619). The 2012 Statistical Abstract: Labor Force, Employment and Earnings. Retrieved from http://www.census.gov/compendia/statab/2012/tables/12s0619.pdf
U.S. Department of Labor. Office of Disability Employment Policy. (2014). Disability Employment Policy Resources by Topic. Retrieved from http://www.dol.gov/odep/
West, Cornel. (1993). Race matters. New York, NY: Vintage Books.
Valentine, K. & Torres, M. (2011). Diversity as topography. In L. Greenfield and K. Rowan (Eds.), Writing centers and the New Racism: A call for sustainable dialogue and change. (pp. 192–210). Logan: Utah State University Press.
Vance, M. L. (2007). Disabled faculty and staff in a disabling society: Multiple identities in higher education. Huntersville, NC: Association on Higher Education and Disability (AHEAD).
Villanueva, V. (2006). Blind: Talking about the new racism. Writing Center Journal, 26(1), 3–19.
Weinberg, S. (2008). Monitoring faculty diversity: The need for a more granular approach. The Journal of Higher Education, 79(4), 365–387.
Weaver, M. (2006). A call for racial diversity in the writing center. In C. Murphy & B. Stay (Eds.), The writing center director’s resource book (pp. 79–91). Mahwah, NJ: Lawrence Erlbaum.
Wells, J. (2014, March 20). Hidden in plain sight: What the WOA Census reveals about writing centers and writing center directors. Paper presented at the Conference on College Composition and Communication, Indianapolis, IN.
Xie, Y. & Goyette, K. (2003). Social mobility and the educational choices of Asian Americans. Social Science Research, 32(3), 467–498.
Appendix A
Survey Questions Sent to Writing Center Directors through Survey Monkey
- What is your job function?FacultyStaff
Other:______
- What is your job title?Writing Center DirectorAssistant Director
Coordinator
Writing Program Administrator
Other:______
- How/Why did you become a Writing Center director?VolunteeredAssigned to task by department chair/administrator
Was hired for the job
Other:______
- What type of institution did you attend as an undergraduate? Check all that apply.2-year4-year
Urban
Suburban
Rural
HBCU
HSI
Tribal College
Small
Mid-sized
Large
Public
Private
- What type of graduate institution did you attend? Check all that apply.PublicPrivate
Elite
- At what type of institution do you work now? Check all that apply.2-year4-year
Urban
Suburban
Rural
HBCU
HSI
Tribal College
Small
Mid-sized
Large
Public
Private
- What is your education level?PhDEdD
MA
Other:______
- What is your academic discipline? Check all that apply.LiteratureComposition
Linguistics
Education
Other:______
- What is your age?20-2930-39
40-49
50-59
60-69
70-79
- Are you a native speaker of English? If not, please specify.YesNo:______
Native bilingual:______
Other languages spoken:_____________
- What racial/ethnic categories do you identify with? Check all that apply.African American/BlackCaucasian/White
Asian
Native American
Hispanic or Latina/o
Other:______
- Do you identify as disabled?YesNo
- What is your gender?MaleFemale
Other:______
- Do you identify as GLBT?YesNo
- Which professional organizations are you are a member of?IWCARegional WC group
MLA
NCTE
Other:_______________
- If you are not a member of any professional organizations, please explain. Check all that apply.No InterestFunding/money
Did not know about these options/organizations
Other:______
- Which professional conferences have you attended in the past ten years?IWCARegional WC conference
CCCC
MLA
Other:___________________
- If you do not attend professional conferences, please explain. Check all that apply.No interestFunding/money
Did not know about these options/organizations
Family responsibilities
Other obligations:_______
Appendix B
Follow-up Survey Questions Sent to Directors Who Identified as Disabled
Thank you for your agreeing to provide some follow-up information for our survey! We are extremely appreciative of your efforts. Could you please respond to the following questions in your own words:
What type of disability do you have?
Have you experienced job discrimination because of it?
Have you disclosed the disability at work?
How do you feel the disability interacts with or enhances your job capabilities (i.e. a director with dyslexia may be more sensitive to students and tutors with the same)?
Do you find barriers at the IWCA conference or other conferences?
Are the materials of the IWCA (website, publications, mailings) accessible to you?
Annotation:
Thanks to O’Neil Provost and Veronica Inchauste from the Office of Survey Research, University of Texas Austin for survey analysis work, and to Cynthia Cochran and Karen Johnson for careful reading of the text. Thanks to R. Michelle Voiles for research assistance, to Alex Salazar for technical assistance, and to Kristin King, Amanda McGregor, Maximillian Vis, Trey, Robyn Skinner, and four anonymous reviewers for their helpful feedback.
- The most recent WCRP survey focuses on writing center contexts in a broad sense, with inquiries about writing center director demographics being only one of many sites of exploration, while the National Census of Writing project reports on information about writing program administrators of all types—including first-year writing directors, writing across the curriculum coordinators, and writing center directors. Thus, while both of these projects provide rich data and insights into the contexts in which many of us work, they do not focus solely or intentionally on the demographics of writing center directors. We do feel that our work perhaps anticipated these projects’ move for data collection and their work points to a growing impetus for writing administrators to engage in self-reflection based on data-driven, self-reported evidence.↩
- We believe these numbers to be not entirely accurate, since Shouse asked about all Lab staff, not just the director.↩
- It is important for us to note here that we are aware of the WCRP study currently being conducted by Harry Denny of Purdue University. However, when we first began this project and facilitated our research, he had not yet begun his project.↩
- Though WCRP has conducted five total surveys, at the time of our writing, only the survey for AY 2003-2004 was published in a report. The data for all years of surveys is now available on the Purdue OWL website.↩
- This date refers to when we collected the data for this article.↩
- These clustering effects can be checked against the data produced by the Chronicle of Higher Education (2011) article “Diversity in Academe: 2011: Data on Doctorates, Students, and Faculty.”↩
- One reviewer had a problem with this study, but it was the most recent, accurate and authoritative one we could find. We invite readers to inform us if they know of a better one.↩
- One reviewer commented that to her, and she suspects, to many others, “the success of learning standard academic English translates to a form of empowerment.”↩