
Beth A. Towle, Salisbury University
Stephanie N. Davis, Salisbury University
Abstract
This article describes the process and results of an assessment project that examined the demographic and academic success data of writing center users at a regional comprehensive university across a five-year time period. The assessment found that undergraduate users of the center were more demographically diverse and academically successful than the university’s total population, and the authors discuss how they will use the results of this assessment to make changes to their writing center’s hiring and training practices to better align with their student user population. The article also discusses complications in working with an institutional research office and makes suggestions for assessment that is replicable across institutions so that writing centers can share data.
Keywords: Assessment, Retention, Diversity
Introduction
Like many writing centers, our University Writing Center (UWC) has seen major changes over the last few years. We are continually seeing more non-traditional and graduate students in the writing center, while moving away from such a large number of first-year writing (FYW) students, as our institution’s FYW program’s curriculum moved toward more drafting processes and individualized feedback opportunities. At the same time, our university has been reckoning with racist incidents on campus as well as the national incidents of police killings of people of color. As writing center praxis has taken recent turns to asking serious questions about our field’s responses to racism, ableism, and classism in our centers, we found ourselves asking these questions: Who were we seeing in our writing center, and were these students actually benefiting from using our spaces? Our center collects a lot of academic and writing-focused data about majors, home languages, international student status, and session details. But we do not collect demographic data that tells us about who we serve beyond these measures. To actually understand the questions we had, we needed institutional data as well as data about student success.
It is not enough, though, to simply collect data. Our foremost goal was not just to have numbers to prove effectiveness. We wanted this assessment to challenge our notions of who we are as a center, and we wanted to use the results to guide measurable change, such as evaluating our hiring and outreach practices and including more relevant training practices. In this article, we present our assessment project and its findings, followed by a discussion of how assessment has led us to make change in our center through both our practices and our long-term planning. In particular, we focus on what this assessment taught us about using large-scale data to better understand our services, with our hope being that our lessons will help others develop better assessments for their own local contexts. We also discuss how this type of assessment opens up pathways for replication and the sharing of data across institutions. First, we present scholarship on writing center assessment, including work that expands our notions of what assessment can be and do. We then present our methods and findings, focusing on both the demographic and academic success results. We analyze the results and discuss how we see this information asking us to rethink some of our ingrained practices, including tutor recruitment and hiring, training, and development of long-term goals for our center. We also discuss how this project has opened up ways to work with other student support programs on our campus to better serve the students we actually see in the center, not just the students we imagine as ideal users. Finally, we share the lessons we learned about assessment and how we could improve our assessments in the future. Our goal for this article is not simply to share the data but to demonstrate why writing center assessments matter, how they can reflect a writing center’s values, and the need for developing stronger assessments by questioning our practices and current assessment techniques.
Assessment in Writing Centers: Global vs. Local
In 1997, Neal Lerner published his article “Counting Beans and Making Beans Count” in Writing Lab Newsletter, detailing assessment in which he tracked student success in first-year composition (FYC) for students who did or did not use the writing center. Using matching groups of SAT verbal scores, Lerner was able to compare the student ID numbers of writing center users to those students enrolled in FYC. He found significant evidence that using the writing center made an impact on the success of students entering college with lower SAT scores. Of those students, the ones who used the writing center did better in their composition courses compared to their non-writing center-using peers. In his article, Lerner stressed the importance of writing center administrators regularly using this type of quantitative data to demonstrate the importance of the writing center to university administrators. He writes, “our institutional survival is often dependent upon simple, straightforward numbers” (p. 3).
In the years since Lerner published his piece, writing centers have been more likely to do this type of large-scale assessment. However, not much scholarship has guided the theory and practice of assessment beyond the basics of “how to.” Lerner himself reflects on the lack of scholarship on assessment in his 2015 reflection on “Counting Beans,” discussing how issues such as lack of administrator expertise on assessment and quantitative research skills, lack of financial and labor support for many administrators, and lack of data-sharing from institutions can hinder the ability of many centers to do this research. Lerner stresses the need for the field to be more supportive of this work because “the opportunity lost here is not merely assessment of our particular centers, but research on writing centers more generally, the essential knowledge we need to build an academic field” (para. 3). Assessment is important, but it is understudied within the field or so institutionally localized that new methods or findings are not broadly shared with writing center studies as a whole.
The problem of institutionally localized assessment is one that the field has run into throughout the history of assessment scholarship. Ellen Schendel and William Macauley’s 2012 book Building Writing Center Assessments That Matter argues for programmatic assessment focused on institutional contexts. They give practical advice, telling centers to use their already-collected data to develop smaller-scale assessments and to collaborate with others to do this work. Schendel and Macauley say that assessment should be used to improve quality and focus of services, with the focus being on assessment questions that matter to their own institutional context before replicating existing projects or scholarship. Schendel and Macauley’s book is one of the only on writing center assessment, but it largely ignores the global context to focus on the local. This focus mirrors what Miriam Gofine (2012), in her Writing Center Journal (WCJ) literature review on assessment in writing centers, says. According to Gofine, while writing center assessment scholarship exists, there is “limited consensus on what should motivate these assessments” (p. 177). Gofine points to the work of Isabelle Thompson (2006) as one of the few pieces of scholarship that discusses assessment beyond simply an institutional mandate. Thompson (2006) points out the need for assessment that is motivated by a writing center’s internal goals. Assessment can serve not only as a measure of how a writing center contributes to an institution, but also as a way to demonstrate the writing center’s values and how those values play out beyond subjective narratives. However, even if assessment is internally motivated, it often lives and dies within the institution itself, keeping assessment local and ignoring the global.
One study that does aim to apply their findings to the writing center field at large is presented in Pam Bromley, Kara Northway, and Eliana Schonberg’s (2013) WCJ article “How Important is the Local, Really?.” In their article, the three authors created a cross-institutional study of student exit surveys at their different types of institutions: a large public land-grant university, a medium-sized private university, and a small liberal arts college. Through their study, they found that even though they are located across vastly different institutional contexts, they found similar results from their students’ surveys: their writing centers were serving higher populations of racial and ethnic minorities than their university populations at large, their writers have similar motivations for attending their sessions, and they all have generally high satisfaction rates[1]. Bromley et. al (2013) also highlight that because their institutions vary in many important ways, it shows that their findings can be applied to the writing center field broadly as a whole. The article is one of the few that highlights how we can use collaborative research as a way to move beyond our local contexts into more global assessment scholarship that pushes the field forward.
Writing Center Assessment Using Institutional Data
In the last decade, writing center scholars have begun to use institutional data to assess their center’s impact on student success and to better understand user populations, as well as to make arguments for the global sharing of assessment findings. There has been an increase in the number of writing centers sharing their data publicly, with the goal of eventually being able to compare data cross-institutionally. At the 2017 International Writing Centers Association’s (IWCA) annual conference, Eric Klinger, Harry Denny, and Eliana Schonberg presented their work to develop a cross-institutional depository for writing center assessment data. Since then, Denny and Klinger have published assessment data through the Purdue OWL’s research portal. The Purdue On-Campus Writing Lab (2023) has updated its assessment data using interactive charts each year on its website. Unfortunately, other than the University of Colorado Boulder assessment report (Sailor, 2016), no other writing centers have published their data through the Purdue OWL website.
Using institutional data can not only reveal writing center successes but also areas in need of improvement. Lori Salem’s 2016 study on students who did and did not use the writing center at Temple University has been foundational in demonstrating the possibilities of institutional data in making an impact on writing center practices. In her article “Decisions…Decisions: Who Chooses to Use the Writing Center?,” Salem used institutional data on SAT scores and demographics to track which students were using writing center services and which students were not. What she found was that “the choice to use the writing center is raced, classed, gendered, and shaped by linguistic hierarchies” (p. 161). Salem concluded that writing centers need to be less complacent in their outreach efforts, expanding programming and making sure writing center pedagogy actually works for students.
These efforts to expand both the role and the circulation of assessment using institutional data have the potential to challenge our “grand narratives” (McKinney, 2013) and change practices to make writing centers more accessible, inclusive, and programmatically responsive. Assessment is not a perfect instrument – Asao Inoue (2015), among others, has discussed the ways in which some assessment can perpetuate racism and inequity in academia – but it can provide an additional viewpoint outside the subjective perspective of a writing center administrator. Collaborating with institutional research (IR) offices in particular can help writing center administrators see and understand their work in new ways. Work like Lori Salem’s at Temple or Harry Denny’s at Purdue ask writing centers to use institutional data not just to assess the status quo but also to make change at the local level and beyond.
Our assessment was directly influenced by the work being done at Purdue, as Beth was a graduate student there when the Writing Lab began doing this type of assessment. Replicating these methods at our institution was not a one-to-one, however. Our population at a regional comprehensive with mostly local students is a very different context from Purdue’s population as a research-one with a large international student population. For that reason, our methods had some similarities but were adapted in response to unique needs. As we discussed in our introduction, we were especially interested in learning more about our center’s particular users. In the next section, we discuss the methods of our assessment study, including information about our collaboration with our IR office as well as this study’s particular limitations. These methods directly responded to our two guiding questions:
- Who is coming to the University Writing Center?
- What is the academic impact on UWC users?
Methods
Earlier UWC Assessment
To understand how our assessment project developed, we must first explain our context. Beginning in 2016, there were several major overhauls of our UWC’s staffing and operations. First, we transitioned from a small office in a mostly hidden corner of the student union building that was constructed in 1988. In this space, there was only room enough for three in-person tutoring sessions to happen concurrently. In 2016, we transitioned to a newly constructed academic commons building in which we tripled the size of our tutoring space, were designated an attached 24-seat classroom and two separate individual labs, and received major technological advances incorporated into the design of our space to promote hybrid capability and greater access to our students. This move also put us closer to other academic support services like the library and Center for Student Achievement (CSA), and we saw more foot traffic as a result of being more visible in a brand-new building. In 2017, we hired a new faculty director who instituted programmatic changes, including adopting WC Online, that made it easier for us to track usage data and focus more on assessment. In 2019, we hired a new faculty associate director and in 2020, the administrative assistant position was reclassified to an academic program specialist, so between 2017 and 2020, the administrative team grew and changed in an effort to support increasing demands for services and programming.
We have internally collected usage data since this time of restructuring, but as we gathered several academic years’ worth of data, we were able to look at larger-scale assessment in collaboration with our campus’s IR office. As a starting point for this project in 2021, we decided to use data we collected from 2015-2020 so we could follow at least one cohort of students as they progressed through their academic career.
Current Assessment Project
This project was influenced by Lerner’s (1997) “bean counting” and the Purdue Writing Lab’s (2023) public-facing assessment project. The methods for this study were also recommended to us by our IR office so that they could best perform their statistical work for the factors we wanted to identify. In this section, we describe the ways we collected and shared data with IR.
Our institution, a public regional comprehensive in the Mid-Atlantic United States with a population of about 8,000 students (7,000 undergraduates and 800-1,000 graduate students), had a faculty learning community that focused on developing assessment projects across disciplines on campus. Each year, they offered a fellowship with a small stipend to faculty and staff who wanted to complete an assessment project with support from the IR office. In 2021, we applied to and received this fellowship which gave us the support we needed to share our data with IR and find out how our center was meeting campus needs. This project would be a way to not only better understand the demographics of our writing center users but would also serve as a way to align ourselves with goals from the university’s strategic plan. With enrollment and retention being of particular concern to many institutions – including ours – as a result of the pandemic, we wanted to see if the UWC played a role in student success. With a small team of data analysts from IR, we developed an assessment project that helped us better understand our center while also demonstrating our role as a student support service within the institution.
We connected with IR’s data specialists early in the process and asked what kinds of data we could get access to in an IRB-approved study [2]. After our discussions with them, we decided to focus on three points of demographic information and three points of academic information from Fall 2015 through Spring 2020 [3]. For the demographic data, we focused on race/ethnicity, transfer status, and Pell Grant eligibility. Because IR is restricted from providing data that could reveal student names or identity groups, we were not able to drill down further on race/ethnicity. As a predominantly white institution (PWI), we decided to look at the use of the writing center by non-white students as a broad category. For transfer status, we looked at the rates of users who were first-time students and users who had transferred into the institution [4]. Finally, we decided on Pell Grant eligibility because it is a way of looking at socioeconomic class. Socioeconomic data is notoriously tricky to capture through institutional data and student profiles (Towle, 2023), but using government assistance for tuition, particularly Pell Grants, which are for students from low-income backgrounds, can be one way to at least start to measure usage based on class.
The academic data included overall GPAs, retention rates, and success and stop-out rates. These numbers were compared for both users and non-users of the UWC, in addition to comparing both groups with the university’s population as a whole. Additionally, IR was able to determine statistical significance [5] in finding that students who used the UWC a mere two times over the course of their time at the university had higher GPAs and retention rates. Retention and success rates are a measure of achievement the institution uses to compare itself to campuses within the state’s university system and other peer institutions. In the recent years since the onset of the pandemic, the university has been especially concerned with retention and continued enrollment. Therefore, we wanted to capture that data to see if the UWC had an impact on these measures of success.
In order for IR to perform the statistical analysis, we first had to clean up and de-identify all of our data. As mentioned earlier, in 2017, our UWC began using WC Online, the all-in-one scheduling system that also collects data about students (input by the students themselves when they create their accounts) and their writing center sessions (input by both the students when they make an appointment and by consultants after the session). This data can be easily exported into an Excel spreadsheet where we filter columns and rows to see the data we need for various reasons, such as tracking student majors, academic years, or what writing concerns they want to work on in their sessions. Before we adopted WC Online in 2017, this data collection was done via entering session information into Microsoft Access from a separate, institutionally-created scheduling website, then exported into Microsoft Excel. Therefore, since we are tracking data from 2015 from three different systems during the time of our study, we had to collate data from multiple spreadsheets into one.
For this round of assessment, we only needed to provide IR with student ID numbers, many of which repeated due to a number of individual students using the UWC more than once [6]. We put together an Excel file that included these ID numbers, including all instances of repeat visits, which IR could then use to see how many times students visited the center (and across which semesters) and take that into consideration for the academic information described above. There were some ID numbers that were incorrect due to student error when they signed up for accounts or sessions, such as ID numbers that were too many digits, not enough digits, or a single number 1 or repeated 1s if the student wasn’t sure of their ID number when they created their account, so we used our student information portal to find the correct IDs for these few students. And when we weren’t able to verify a couple of students on our end, IR filled those gaps for us from their access to the university’s admission records. IR used the student IDs to compare them to institutional demographic and academic information as we agreed upon earlier in the process. IR used the statistics program Statistical Package for the Social Sciences (SPSS) to do this work.
One of the most challenging limitations of this process was the fact that our IR office is understaffed and has a high turnover rate. The lack of consistent assessment team members, particularly the lack of a consistent coordinator to lead the team, has led to uneven policies and practices. In addition, our university does not have a culture of department and program-led assessment, which means our IR office does not have policies or procedures in place to easily share statistical data, including p-values, means, and averages. It is especially rare for assessment data to ever be shared beyond individual programs at our university, making it more difficult to justify the need for IR to share raw data with requesting faculty or staff. The combination of the lack of assessment culture and limitations of IR staffing means that it is nearly impossible for statistical information to be easily shared between interested parties, which severely limited how “close” we were able to get with our own data.
Due to these IRB limitations, IR could not give us raw data. Therefore, they used tables with aggregate numbers and percentages for each semester or academic year to report results back to us. We then used these tables to develop comparative graphs that could show data across multiple years, which is what we present in this article. In our analysis of this data, we focus on what the data tells us about the place of the UWC within the institution, as well as what it tells us about our own practices and pedagogies.
Results
For this project, the data is broken down into distinct categories of demographic and academic data. It is important to note that we only collected the necessary data (ID numbers, in this case) for our one-to-one writing sessions. For all other offerings, such as workshops or in-class peer review sessions, we only collected students’ names on any sign-in sheets after 2022, so we were not able to track this data for anything other than one-to-one writing sessions for the purpose of this project. For future exploration of this project, we want to include students who participate in programming such as workshops.
Demographic Data
The demographic data of the UWC users was further broken down into subcategories of race/ethnicity of undergraduate and graduate students, first-time/transfer status of undergraduate students, and Pell Grant eligibility of undergraduate students.
Race/Ethnicity
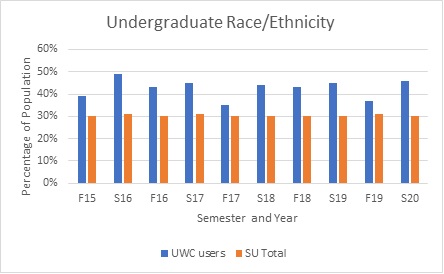
As can be seen in Figure 1, the percentage of non-white users in the writing center is significantly larger than the percentage of non-white students that make up the university population as a whole.
Figure 1
Undergraduate Race and Ethnicity
Transfer Status
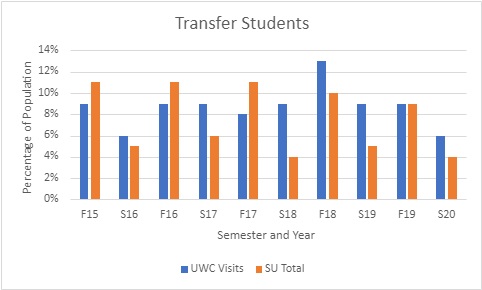
Transfer students are defined as those students who transferred into our university from another higher education institution such as a community college or other university. As depicted in Figure 2, the compared percentages of transfer students in the total population and the percentage of transfer students among UWC users were more erratic, with earlier years showing a significantly lower number of transfer students in the UWC compared to the larger student population percentage, while later years showed the UWC user percentage was higher.
Figure 2
Transfer Students
Pell Grant Eligibility
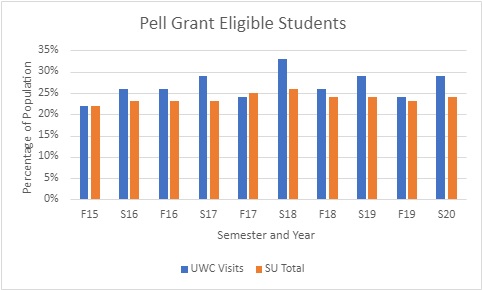
Pell Grant eligibility refers to the number of students who were deemed eligible for national Pell Grants, which are awarded to students with significant financial need based on personal or family income. As depicted in Figure 3, the percentage of UWC users who are Pell Grant eligible is higher than the percentage of the university-wide student population that is Pell Grant eligible.
Figure 3
Pell Grant Eligible Students
Academic Data
The academic data refers specifically to GPA, retention rates, and stop-out rates of first-time and transfer undergraduates.
GPA
The general trend for all undergraduate UWC users, regardless of first-time or transfer status, was that their cumulative GPAs were higher than those of non-users. Non-users always had average GPAs under a 3.0, while users had GPAs above a 3.0 [7].
Figure 4
GPAs of First-Time Undergraduates
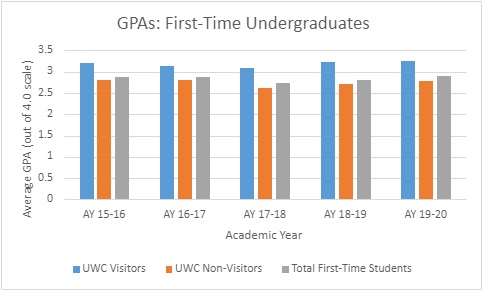
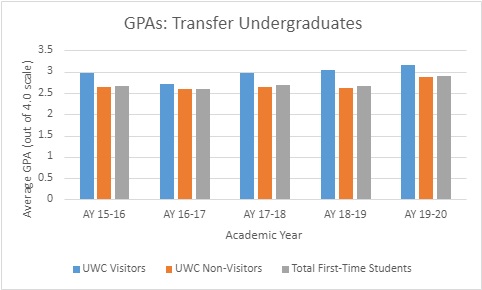
Figure 5 shows that GPA rates for transfer undergraduates who visited the UWC were consistently higher than transfer undergraduates who did not visit the UWC as well as the total overall GPA for all transfer undergraduates.
Figure 5
GPAs of Transfer Undergraduates
Retention
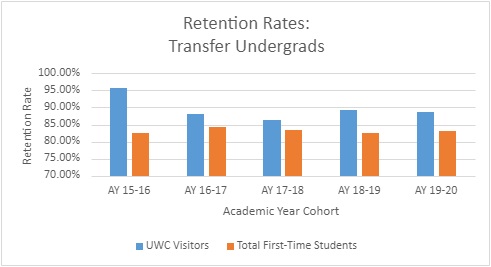
Our institution defines retention rates as the number of students who were enrolled in consecutive semesters or who completed their degrees by graduating. Figure 6 shows that first-time, first-year student UWC users are retained at a higher rate than the university’s at-large population of incoming first-year students. We can also see the same trend for transfer undergraduates in Figure 7 [8].
Figure 6
Retention Rates of First-Time Undergrads
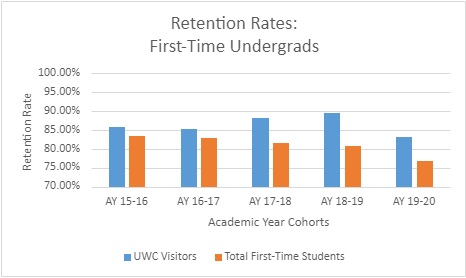
Figure 7
Retention Rates of Transfer Undergrads
Success and Stop-Out Rates
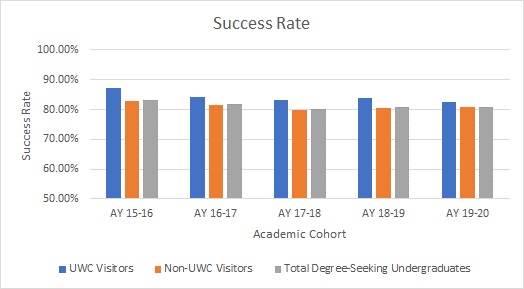
In this context, we are defining success rates as the number of undergraduate students who graduated or persisted as of Fall 2021. This end date was intentionally set beyond the original scope of the project so that IR could determine whether those students who enrolled within the 2015-2020 timeframe were persisting to the current date and would accurately be counted in the retention data. Figure 8 shows that the success rate for incoming academic cohorts is higher for UWC users compared to both non-users and the total student population [9].
Figure 8
Success Rates
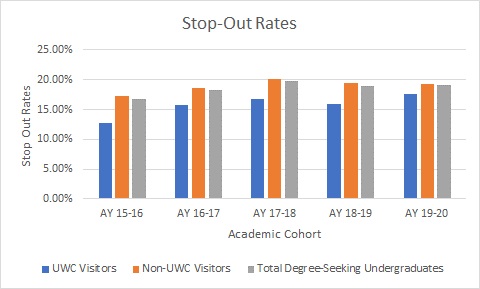
Our university defines stop-out rates as undergraduate students who did not graduate and were no longer enrolled in the university as of Fall 2021 within a five-year period. Figure 9 shows that the stop-out rate for incoming academic cohorts is lower for UWC users compared to both non-users and the total student population.
Figure 9
Stop-Out Rates
Discussion
Based on this data, there are two major themes emerging here: 1) the writing center sees a more demographically diverse student population in terms of percentages than the university as a whole, and 2) usage of the writing center is strongly correlated with the impact on the GPA, retention, and success rates of our students. It is important to note that these academic success correlations are statistically significant after just two appointments in the writing center. In our analysis, we discuss how these results impact our understanding of writing center usage patterns as well as the possible impact the UWC has on our students. We also discuss how our results led us to a broader understanding of assessment and its importance across institutions.
Demographic Data
That students who are often marginalized in a predominantly white institution (PWI) based on race/ethnicity, class, and even transfer status (which in itself is often connected to race and class) use the writing center at high rates is not a surprise. However, it does demonstrate that the writing center might be serving a need that is unmet by the campus at large. Writing centers have complex relationships with the identities and identity matrices among student writers, tutors, and administrators (Denny, 2010; Grimm, 1999). Writing centers can also be guilty of marginalizing students through tone policing, forced code-switching, and tutor affect (Garcia, 2017). However, writing centers are often quite visible on their campuses, whether physically visible as part of a library or academic commons or made visible to students by instructor referral and endorsement. Therefore, writing centers are accessible to students who may not be able to find other resources on campus. At our institution in particular, the UWC currently enjoys a high level of visibility with a location in the library, a connection to the provost’s office in our reporting line, and a highly supportive faculty. Faculty will often refer students to the UWC, and being located next to the TRIO office, which serves first-generation and often racially minoritized students, means we also see a large number of students who are already connected to a campus support system.
The rates of non-white, transfer, and Pell Grant eligible students who visit the UWC are also interesting in that this follows trends found by the campus’s other student support services, particularly the Center for Student Achievement (CSA) where generalized tutoring and academic support is offered. Students from these categories are particularly marginalized at our PWI. And although we have a relatively high number of transfer and low-income students, those students are not necessarily part of the traditional narrative of the “average college student” held by a public four-year university. In acknowledging the changing reality of the university’s population, we began to more intentionally accommodate students who may have had difficulties scheduling or attending in-person writing center sessions, such as distance/hybrid students from satellite campuses, students who are studying abroad or working at off-campus internships, students who may be on a military or emergency service assignment, and pregnant, parenting, or caregiving students, among others. That the writing center serves marginalized undergraduates is not surprising per se, but it should force us to have conversations about the larger university support system, as well as questions about whether the support we offer actually helps the students who seek us out, and based on the results of our assessment, we have reason to believe that we do. Later in this article, we will discuss how this assessment project, and the demographic numbers in particular, has us reconsidering the ways we hire, train, and staff tutors, as well as how we assess the success of sessions.
Academic Data
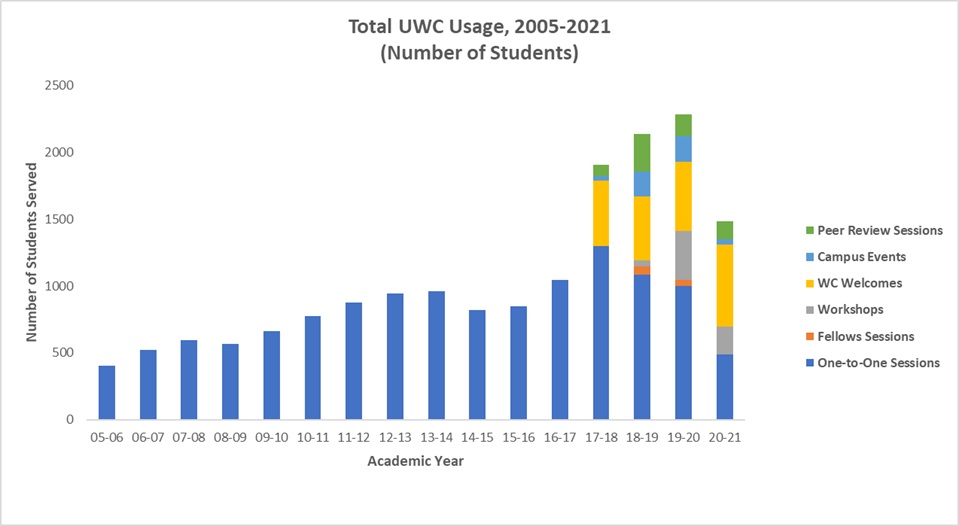
While we are not necessarily surprised to learn that the UWC positively impacts student success, we were excited to see how strongly writing center usage correlates with higher GPAs, retention rates, and success, as well as contributing to lower stop-out rates. That UWC usage is one of the possible contributing factors to students crossing the threshold of the 3.0 GPA is particularly interesting to us. Additionally, we are interested in how these numbers hold steady, or even increase, when compared over time. Of particular note is the increase in the difference in retention rates of writing center users and non-users from 2017-2018 onward, as seen below in Figure 10, which is when our new administrative team began making systematic changes in data management and campus outreach offerings. The more dramatic increase in the retention rates beginning in the 2017-2018 academic year could have been due to several factors. This was the academic year where the UWC relocated to the new library, hired a new faculty director, and rebranded. It was a time of renovation, more marketing, more visibility, more direct access to students on campus, and more programming (such as a fellows program and in-class workshops, as demonstrated in Figure 10), so it not only directly impacted our usage numbers, but also our ability to retain students into the next academic year. We also switched to WC Online, which allowed us to track this information more accurately and with more detail.
Figure 10
Total UWC Usage by Number of Individual Students Served, 2005-2021
The difference in GPAs, retention, and success rates for the writing center also reflects trends from other institutions, contributing to a powerful narrative of writing center impact. The Purdue Writing Lab also sees higher numbers across these three areas for Lab users (Purdue, 2023). In an assessment project following a freshman cohort at the University of Colorado Boulder, writing center usage was correlated to higher GPAs and retention as students progressed all the way into their sixth semesters at the university (Sailor, 2016). The academic success of UWC users is part of a larger pattern of success in writing centers across the country.
Using Assessment to Make Changes
The demographic and academic data from this assessment project has made us rethink how we operate the UWC so that it best serves everyone, particularly the minoritized or underserved populations that actually make up a large percentage of our writing center usage. Our first point of change involves recruitment and hiring. Our UWC has long made it a point to hire diversely and to try to match the demographics of the university, but the percentage differences between the institution’s demographics and our user demographics is wide enough to make us realize that we actually need to hire even more diversely to match our actual user body, not just the student population as a whole. It also made us realize that we were not considering transfer students as part of our hiring diversity. In fact, when we looked at the academic records of our current tutoring staff, we realized that only a couple had been transfer students at some point in their education. Hiring needs to be more explicit and include hiring for diversity beyond perceived race and ethnicity. Additionally, we realized our recruitment practices could be better. We have begun working with TRIO to identify possible tutors from their program, as well as made our hiring process more transparent by supplying interview questions to interviewees ahead of time, sending recruitment emails to the whole campus, and sending targeted hiring notices to faculty and programs we know work with diverse or marginalized students. Additionally, our staff is finally large enough each semester that IR is willing to do demographic assessment similar to this project within just the center so that we can see how diverse our staff really is, across many different categories of diversity, at an anonymous level. Having this information will only improve our services and help us become a diverse writing center that is trained to work with the students who do come in (Rafoth, 2015).
Similar to staff recruitment, there is also a need for assessment that examines our other forms of outreach, particularly the workshop and fellows programs, to see a wider picture of the UWC’s ability to provide outreach to students. For example, when seeing our institution’s transfer numbers and knowing that first-generation student status also connects to institutional transfer, we have decided we need to place more emphasis on how transfer and first-generation students are finding and using the center. Our administrative team has begun to do additional research on transfer students and attended an all-day Rocky Mountain Writing Centers Association workshop about transfer student support in June 2022.
The Need for Multidimensional Assessment
Quantitative assessment can be useful, but it does have dangers. Numbers can obscure the complexities of student experiences, even while they gives us important information (Caswell, 2020). This assessment project can only tell us about general patterns. The demographic numbers do not reveal the nuances of why students choose to use the UWC or what their experiences are during and after sessions. For example, one question this data reveals for us is: Are more non-white students using the writing center because of institutional racism in which faculty are more likely to tell those students to use the writing center because of perceived need for remediation? If that is the case, then the high number of marginalized students using the center actually reveals a problem, not an asset. Similarly, the academic data demonstrates that the UWC might have a real impact on student success. However, this success might also be related to larger patterns of how students use support systems and resources on campus. Data and graphs can only tell us one small part of the story about our writing center and its impact. We need to also develop qualitative assessment protocols that can help us understand how students perceive and experience the UWC.
Qualitative assessment would also need to go beyond just post-session evaluation forms. These evaluation forms tell us very little about the long-term impact of the UWC, and scholarship has demonstrated that writers and tutors both see them as inadequate for their needs (Levin, et al., 2021). Our center only gets completed evaluations back from less than half of students, even when we offer the form both in physical and online formats. On top of that, our forms are anonymous, so we cannot link them to any actual sessions; nor would we want to, as the anonymity of the form allows students to give their honest feedback. It can also be difficult to gather and utilize data from students who are already experiencing communication fatigue from the institution’s constant emails, texts, and evaluations. Compensated focus groups might be one way to develop more qualitative assessments that allow students to “speak back” to the writing center, describing their experiences and choices in how they use (or don’t use) the center. As Lori Salem’s (2016) quantitative work points out, writing centers often do not account for students who do not use the center. A complete assessment plan, then, would mean soliciting and using feedback from non-users. Partnering with TRIO in a programmatic assessment, for example, would be a way to assess the UWC from the perspectives of frequent users, occasional or one-time users, and non-users.
The Need for Shared Data and Replication
This assessment project highlights the need for shared assessment data across institutions. The Purdue Writing Lab has tried to collect shared assessment data from across institutions, but the call of Klinger et al. (2017) to share this work has largely gone unheeded. As of right now, only Purdue and University of Colorado Boulder have shared their assessment data publicly through the Purdue Writing Lab’s research page. In their WCJ article about replicability, Susanne Hall and Holly Ryan (2021) argue for the place of replicated and replicable work in writing center studies, including in quantitative projects such as assessment or in studying citation practices for a journal or the field. While Hall and Ryan caution against conflating replication with positivist research, they do see a need for its use in how we continue to share data across institutional contexts and in the field more broadly.
Our work demonstrates the need for writing centers to share data across institutions and to create a larger depository to help writing center administrators better understand the local and global trends in usage, student success, and demographic data. When this shared work does happen, it is often at large research institutions, and not at smaller regional comprehensives like ours. Having other regional comprehensives to share our data with would allow us to not only compare our usage data and success rates, but it would give us the opportunity to make arguments to upper-level administration about how budgetary and labor stability can help us keep up with our peer institutions. Additionally, having data for and from more than just large research institutions helps us understand how context does and does not impact writing center work—a way to make visible the local and the global as we continue to debate the value of and relationship between both in writing center studies.
The Difficulty of Assessment: Limitations and Lessons
Perhaps the most significant thing we learned from this assessment project was just how difficult assessment can be to do well, particularly because student and institutional contexts can be so complex and varied. For example, while the correlation between higher GPAs and writing center usage might be a sign we are doing well, it could also be a sign that students who already are help-seeking and are good at identifying and using campus resources utilize the writing center. In future versions of this assessment, it could be beneficial to also compare high school GPAs of writing center users to see if students who come to the writing center were already students who do well in school settings. Starting in Fall 2022, our university’s admission rates increased dramatically, which has translated into increased usage of all student support services on campus. Better understanding who our students are before they set foot in the writing center could help us make connections between student usage patterns and help us identify areas for improvement in outreach and marketing.
The foremost limitation, as we discussed in our Methods section, was our specific context. We [authors] do not have statistical model training and lacked access to institutional records, and there is not a statistical lab or stats education for non-students on campus, which means we relied heavily on the campus IR office to complete the assessment work. Our IR office is understaffed and underfunded, and they have faced major challenges in preparation for a reaccreditation and a new general education curriculum that will need supportive assessment data in the next few years. Additionally, their policies, which are meant to make the sharing of data as smooth as possible between multiple parties, mean they do not share raw data unless specifically requested. The lack of culture and education around assessment at our teaching university, which has historically relied on standardized testing to measure student success, hindered our ability to run specific tests ourselves.
Conclusion and Recommendations for Assessment
This assessment project highlighted areas of need, particularly around outreach and further study into how marginalized students use our services. Assessment helped us make concrete changes to guide the UWC towards more inclusivity while also helping us make our case to administrators that we serve an important campus need. As a result, we have developed a recommended set of best practices for working with IR offices in developing large-scale assessment projects:
- Consider and match your university’s goals and values. Schendel and Macauley (2012) argue that writing centers need to build assessments that will speak to university administrators. With enrollments and retention rates dipping at our institution post-Covid, we knew we needed to focus on how the writing center contributed to student retention and continued enrollment from semester-to-semester. Having numbers specifically related to institutional interests allows writing center administrators to advocate for themselves as it relates to budgets, staffing, and pay. In the last year, our university has particularly called for programming that increases the retention rates of marginalized student populations, such as non-white students and first-generation students. Because our assessment focuses on retention in particular, we are able to argue for additional funding and staff positions based on how we are contributing to larger university initiatives.
- Use assessment to evaluate current goals and develop new ones. In our annual reports, we have a section where we reflect on how we met previous goals and establish new ones for the coming year. Assessments such as this ask us to consider how we are or are not meeting goals, particularly our goals around student outreach and hiring practices. We used our demographic data in particular to establish new goals around hiring more diversely across multiple categories of identity, including transfer status. Assessing goals beyond our own subjective perspectives helps administrators better identify areas where we need to change or improve, as well as allows us to see where we have been successful and what we should continue doing.
- Think about how to assess across multiple forms of service or outreach. While this particular assessment project only focused on one-to-one tutoring sessions, it helped us identify needs for further assessment. In particular, our next assessment projects include using workshop data to assess how workshop attendance impacts writing center usage, assessing the demographics and academic experiences of our tutoring staff, and collaborating with other academic support units on campus to better understand students’ support-seeking habits. One-on-one sessions only capture one aspect of a writing center’s work, and so assessment practices must also make room for how to expand efforts to capture and use data.
Collaborating with IR can illuminate aspects of a writing center, its work, and its impact on students in ways that writing center data alone cannot. While WC Online and other forms of local data collection can reveal many things to administrators, it is limited only to those students who use the center. Working with IR allows the writing center to see who we are and are not serving, and it opens up space for richer data analysis. The expertise of IR statisticians could not be matched by our administrative team, a fact that likely holds true for many writing centers. Partnering with IR, using data to make informed decisions about the future of the writing center, and sharing that data broadly and publicly, enrich not only our local center but the field of writing center studies as a whole. While we certainly ran into speed bumps and the limitations that come with institutional contexts – a problem shared among many forms of writing center research – we learned a great deal about our writing center and its users, as well as how we can better market ourselves to our administrators, an increasingly important point as universities deal with enrollment cliffs and resulting budget constraints. Making visible the work of our writing centers is important work, and we call on other writing center directors to not only do this type of quantitative assessment but also to share it with other institutions and consider best practices as a field for collaborating with IR offices and reporting assessment data. While this article only presents the results of one writing center’s assessment of its users and their success, it contributes to ongoing discussions about how writing centers can make their work not only more visible but also more equitable for all stakeholders.
References
Bromley, P., Northway, K., & Schonberg, E. (2013). How important is the local, really? A cross-institutional quantitative assessment of frequently asked questions in writing center exit surveys. Writing Center Journal 33 (1). 13-37. https://docs.lib.purdue.edu/cgi/viewcontent.cgi?article=1755&context=wcj
Caswell, N.I. (2020). What’s beneath the demographics?: Writing center usage and inequality. Intersection, Spring issue, 25-29.
Denny, H.C. (2010). Facing the center: Toward an identity politics of one-to-one mentoring. Utah State University Press.
Garcia, R. (2017). Unmaking gringo-centers. Writing Center Journal, 36(1), 29-60.
Gofine, M. (2012). How are we doing? A review of assessments within writing centers. Writing Center Journal, 32(1), 39-49.
Grimm, N.M. (1999). Good intentions: Writing center work for postmodern times. Boynton/Cook HEINEMANN.
Hall, S. & Ryan, H. (2021). The neglected ‘R’: Replicability, replication, and writing center research. Writing Center Journal, 39(1-2), 211-233.
Inoue, A.B. (2015) Antiracist writing assessment ecologies: Teaching and assessing writing for a socially just future. WAC Clearinghouse. https://wac.colostate.edu/books/perspectives/inoue/
Klinger, E., Denny, H., & Schonberg, E. (2017, Nov. 11). Cross-institutional research SIG: Fostering empirical inquiry across writing centers [Conference presentation]. IWCA 2017, Chicago, IL, United States.
Lerner, N. (1997). Counting beans and making beans count. Writing Lab Newsletter, 22(1), 1-3.
Lerner, N. (2015, April 16). 18 years after beans-Neal Lerner reflects. Connecting Writing Centers Across Borders: A Blog of WLN: A Journal of Writing Center Scholarship. https://www.wlnjournal.org/blog/2015/04/18-years-after-beans-neal-lerner-reflects/
Levin, K., Selz, S., Steck, M., & Wisz, E.(2021). “Was it useful? Like, really?”: Client and consultant perceptions of post-session satisfaction surveys. Writing Center Journal, 39(1-2), 295-363.
McKinney, J.G. (2013) Peripheral visions for writing centers. Utah State University Press.
Purdue Online Writing Lab. (2023). Writing Lab usage data. Purdue University. https://owl.purdue.edu/research/writing_lab_usage_data.html
Rafoth, B. (2015). Multilingual writers and writing centers. Utah State University Press.
Sailor, P. (2016). Students who used the services of the UCB Writing Center in their first year vs. those who did not: GPA, retention, and graduation rates. Purdue University. https://owl.purdue.edu/research/peer_institution_reports_and_data/documents/20170424120500_ucboulder1.pdf
Schendel, E. & Macauley, W. (2012). Building writing center assessments that matter. Utah State University Press.
Thompson, I. (2006). Writing center assessment: Why and a little how. Writing Center Journal 26(1), 33-61.
Towle, B.A. (2023). Find first-generation students through an intersectional approach to institutional and programmatic data. In K. Ritter (Ed.), Beyond fitting in: Rethinking first-generation writing and literacy education. (pp. 99-114). MLA.
Footnotes
- While it was not part of this particular assessment project, we do track student satisfaction rates internally and have found that we have had as high as a 98% satisfaction rate among our users.↩
- Approved as IRB Protocol #3.↩
- We want to point out that we have focused our assessment on our undergraduate student usage, as our graduate student users tend to come in for more frequent repeat visits, which may actually skew the data for that group.↩
- Something we did not consider for this study, but that we would like to look into further for future iterations of this research, were those students who transfer out of our university into another college or university.↩
- The p-values were difficult to determine from the raw SPSS data provided by IR as they only shared general averages across all semesters. However, in their cleaner table data, they did note which semesters were not statistically significant. The average p-value across all tests was .001.↩
- About 50% of our users are repeat clients.↩
- All GPA data was statistically significant except for the AY 2016-2017 cohort of transfer students. ↩
- All retention rates were marked as statistically significant by IR.↩
- All success and stop-out rate correlations were marked as statistically significant by IR.↩